
Page 81 - Fundamentals of Gas Shale Reservoirs
P. 81
ADDITIONAL GEOCHEMICAL ANALYSES FOR SHALE GAS RESOURCE SYSTEM EVALUATION 61
3.0
Barnett Shale (DGR< 95%)
1.0 Barnett Shale (DGR> 95%)
Fayetteville Shale
–1.0
–3.0
13 C 2 – 13 C 3 –5.0 polars cracking Hydrocarbon
Kerogen
and
–7.0
gases and
aromatics
–9.0 Polars methylated
and cracking
–11.0 parafns
cracking
–13.0
–15.0
1 10 100
C /C 3
2
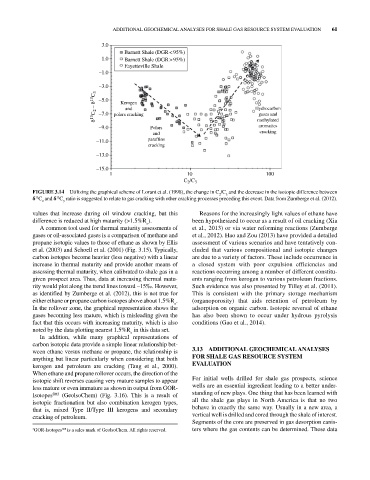
FIGURE 3.14 Utilizing the graphical scheme of Lorant et al. (1998), the change in C /C and the decrease in the isotopic difference between
3
2
δ C and δ C ratio is suggested to relate to gas cracking with other cracking processes preceding this event. Data from Zumberge et al. (2012).
13
13
2 3
values that increase during oil window cracking, but this Reasons for the increasingly light values of ethane have
difference is reduced at high maturity (>1.5%R ). been hypothesized to occur as a result of oil cracking (Xia
o
A common tool used for thermal maturity assessments of et al., 2013) or via water reforming reactions (Zumberge
gases or oil‐associated gases is a comparison of methane and et al., 2012). Hao and Zou (2013) have provided a detailed
propane isotopic values to those of ethane as shown by Ellis assessment of various scenarios and have tentatively con
et al. (2003) and Schoell et al. (2001) (Fig. 3.15). Typically, cluded that various compositional and isotopic changes
carbon isotopes become heavier (less negative) with a linear are due to a variety of factors. These include occurrence in
increase in thermal maturity and provide another means of a closed system with poor expulsion efficiencies and
assessing thermal maturity, when calibrated to shale gas in a reactions occurring among a number of different constitu
given prospect area. Thus, data at increasing thermal matu ents ranging from kerogen to various petroleum fractions.
rity would plot along the trend lines toward –15‰. However, Such evidence was also presented by Tilley et al. (2011).
as identified by Zumberge et al. (2012), this is not true for This is consistent with the primary storage mechanism
either ethane or propane carbon isotopes above about 1.5%R . (organoporosity) that aids retention of petroleum by
o
In the rollover zone, the graphical representation shows the adsorption on organic carbon. Isotopic reversal of ethane
gases becoming less mature, which is misleading given the has also been shown to occur under hydrous pyrolysis
fact that this occurs with increasing maturity, which is also conditions (Gao et al., 2014).
noted by the data plotting nearest 1.5%R in this data set.
o
In addition, while many graphical representations of
carbon isotopic data provide a simple linear relationship bet
ween ethane versus methane or propane, the relationship is 3.13 ADDITIONAL GEOCHEMICAL ANALYSES
anything but linear particularly when considering that both FOR SHALE GAS RESOURCE SYSTEM
kerogen and petroleum are cracking (Tang et al., 2000). EVALUATION
When ethane and propane rollover occurs, the direction of the
isotopic shift reverses causing very mature samples to appear For initial wells drilled for shale gas prospects, science
less mature or even immature as shown in output from GOR‐ wells are an essential ingredient leading to a better under
Isotopes SM3 (GeolsoChem) (Fig. 3.16). This is a result of standing of new plays. One thing that has been learned with
isotopic fractionation but also combination kerogen types, all the shale gas plays in North America is that no two
that is, mixed Type II/Type III kerogens and secondary behave in exactly the same way. Usually in a new area, a
cracking of petroleum. vertical well is drilled and cored through the shale of interest.
Segments of the core are preserved in gas desorption canis
3 GOR‐Isotopes is a sales mark of GeolsoChem. All rights reserved. ters where the gas contents can be determined. These data
SM