
Page 84 - Fundamentals of Gas Shale Reservoirs
P. 84
64 GEOCHEMICAL ASSESSMENT OF UNCONVENTIONAL SHALE GAS RESOURCE SYSTEMS
3.15 MAJOR SHALE GAS RESOURCE SYSTEMS have biogenic sources of silica such as radiolarians and
sponge spicules. When present‐day TOC values are com
The major commercial shale gas resource systems all cur pared to porosity, there is a positive correlation except in the
rently reside in North America. These systems span a variety Montney Shale that shows negative correlation.
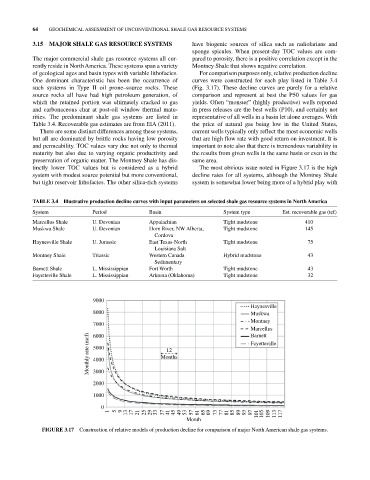
of geological ages and basin types with variable lithofacies. For comparison purposes only, relative production decline
One dominant characteristic has been the occurrence of curves were constructed for each play listed in Table 3.4
such systems in Type II oil prone–source rocks. These (Fig. 3.17). These decline curves are purely for a relative
source rocks all have had high petroleum generation, of comparison and represent at best the P50 values for gas
which the retained portion was ultimately cracked to gas yields. Often “monster” (highly productive) wells reported
and carbonaceous char at post‐oil window thermal matu in press releases are the best wells (P10), and certainly not
rities. The predominant shale gas systems are listed in representative of all wells in a basin let alone averages. With
Table 3.4. Recoverable gas estimates are from EIA (2011). the price of natural gas being low in the United States,
There are some distinct differences among these systems, current wells typically only reflect the most economic wells
but all are dominated by brittle rocks having low porosity that are high flow rate with good return on investment. It is
and permeability. TOC values vary due not only to thermal important to note also that there is tremendous variability in
maturity but also due to varying organic productivity and the results from given wells in the same basin or even in the
preservation of organic matter. The Montney Shale has dis same area.
tinctly lower TOC values but is considered as a hybrid The most obvious issue noted in Figure 3.17 is the high
system with modest source potential but more conventional, decline rates for all systems, although the Montney Shale
but tight reservoir lithofacies. The other silica‐rich systems system is somewhat lower being more of a hybrid play with
TABLE 3.4 Illustrative production decline curves with input parameters on selected shale gas resource systems in North America
System Period Basin System type Est. recoverable gas (tcf)
Marcellus Shale U. Devonian Appalachian Tight mudstone 410
Muskwa Shale U. Devonian Horn River, NW Alberta, Tight mudstone 145
Cordova
Haynesville Shale U. Jurassic East Texas‐North Tight mudstone 75
Louisiana Salt
Montney Shale Triassic Western Canada Hybrid mudstone 43
Sedimentary
Barnett Shale L. Mississippian Fort Worth Tight mudstone 43
Fayetteville Shale L. Mississippian Arkoma (Oklahoma) Tight mudstone 32
9000
Haynesville
8000 Muskwa
Montney
7000
Marcellus
Barnett
6000
Monthly rate (mcf) 5000 Months Fayetteville
12
4000
3000
2000
1000
0
1 5 9 13 17 21 25 29 33 37 41 45 49 53 57 61 65 69 73 77 81 85 89 93 97 101 105 109 113 117
Month
FIGURE 3.17 Construction of relative models of production decline for comparison of major North American shale gas systems.