
Page 79 - Fundamentals of Gas Shale Reservoirs
P. 79
GAS COMPOSITION AND CARBON ISOTOPES 59
0.2 0 0 Barnett Shale
0.7 Vitrinite re ectance 50 –10 Fayetteville Shale
–5
Vitrinite re ectance (%R o ) 2.2 150 Temperature (ºC) Ethane carbon isotope ( 13 C 2 ) –20
Green River late gas (gold tube maturation)
1.2
Temperature
100
–15
1.7
2.7
–25
200
3.2
–30
–35
3.7
250
4.2
–45
4.7
350
5.2 300 –40
–50
0 10 20 30 40 50 60 70 0 5 10 15 20 25
Volume percent methane Gas wetness (%C +)
2
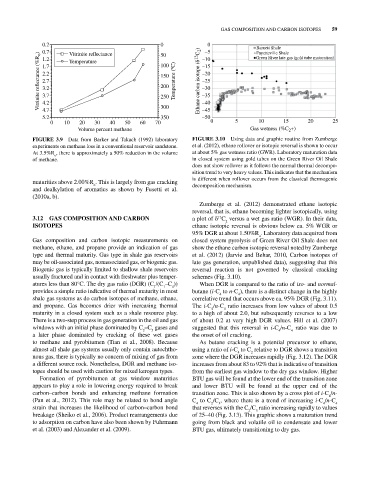
FIGURE 3.9 Data from Barker and Takach (1992) laboratory FIGURE 3.10 Using data and graphic routine from Zumberge
experiments on methane loss in a conventional reservoir sandstone. et al. (2012), ethane rollover or isotopic reversal is shown to occur
At 3.5%R , there is approximately a 50% reduction in the volume at about 5% gas wetness ratio (GWR). Laboratory maturation data
o
of methane. in closed system using gold tubes on the Green River Oil Shale
does not show rollover as it follows the normal thermal decompo
sition trend to very heavy values. This indicates that the mechanism
maturities above 2.00%R . This is largely from gas cracking is different when rollover occurs from the classical thermogenic
o
and dealkylation of aromatics as shown by Fusetti et al. decomposition mechanism.
(2010a, b).
Zumberge et al. (2012) demonstrated ethane isotopic
reversal, that is, ethane becoming lighter isotopically, using
3.12 GAS COMPOSITION AND CARBON a plot of δ C versus a wet gas ratio (WGR). In their data,
13
2
ISOTOPES ethane isotopic reversal is obvious below ca. 5% WGR or
95% DGR at about 1.50%R . Laboratory data acquired from
o
Gas composition and carbon isotopic measurements on closed system pyrolysis of Green River Oil Shale does not
methane, ethane, and propane provide an indication of gas show the ethane carbon isotopic reversal noted by Zumberge
type and thermal maturity. Gas type in shale gas reservoirs et al. (2012) (Jarvie and Behar, 2010, Carbon isotopes of
may be oil‐associated gas, nonassociated gas, or biogenic gas. late gas generation, unpublished data), suggesting that this
Biogenic gas is typically limited to shallow shale reservoirs reversal reaction is not governed by classical cracking
usually fractured and in contact with freshwater plus temper schemes (Fig. 3.10).
atures less than 80°C. The dry gas ratio (DGR) (C /(C –C )) When DGR is compared to the ratio of iso‐ and normal‐
4
1
1
provides a simple ratio indicative of thermal maturity in most butane (i‐C to n‐C ), there is a distinct change in the highly
4
4
shale gas systems as do carbon isotopes of methane, ethane, correlative trend that occurs above ca. 95% DGR (Fig. 3.11).
and propane. Gas becomes drier with increasing thermal The i‐C /n‐C ratio increases from low values of about 0.5
4
4
maturity in a closed system such as a shale resource play. to a high of about 2.0, but subsequently reverses to a low
There is a two‐step process in gas generation in the oil and gas of about 0.2 at very high DGR values. Hill et al. (2007)
windows with an initial phase dominated by C –C gases and suggested that this reversal in i‐C /n‐C ratio was due to
4
4
5
2
a later phase dominated by cracking of these wet gases the onset of oil cracking.
to methane and pyrobitumen (Tian et al., 2008). Because As butane cracking is a potential precursor to ethane,
almost all shale gas systems usually only contain autochtho using a ratio of i‐C to C relative to DGR shows a transition
4
2
nous gas, there is typically no concern of mixing of gas from zone where the DGR increases rapidly (Fig. 3.12). The DGR
a different source rock. Nonetheless, DGR and methane iso increases from about 83 to 92% that is indicative of transition
topes should be used with caution for mixed kerogen types. from the earliest gas window to the dry gas window. Higher
Formation of pyrobitumen at gas window maturities BTU gas will be found at the lower end of the transition zone
appears to play a role in lowering energy required to break and lower BTU will be found at the upper end of the
carbon–carbon bonds and enhancing methane formation transition zone. This is also shown by a cross plot of i‐C /n‐
4
(Pan et al., 2012). This role may be related to bond angle C to C /C , where there is a trend of increasing i‐C /n‐C
4
2
4
4
3
strain that increases the likelihood of carbon–carbon bond that reverses with the C /C ratio increasing rapidly to values
3
2
breakage (Sheiko et al., 2006). Product rearrangements due of 25–40 (Fig. 3.13). This graphic shows a maturation trend
to adsorption on carbon have also been shown by Fuhrmann going from black and volatile oil to condensate and lower
et al. (2003) and Alexander et al. (2009). BTU gas, ultimately transitioning to dry gas.