
Page 237 - Fundamentals of Light Microscopy and Electronic Imaging
P. 237
220 CONFOCAL LASER SCANNING MICROSCOPY
the magnification and to adjust the number of pixels (samples) that cover an object in
order to maintain resolution. Because the same amount of laser light is delivered to a
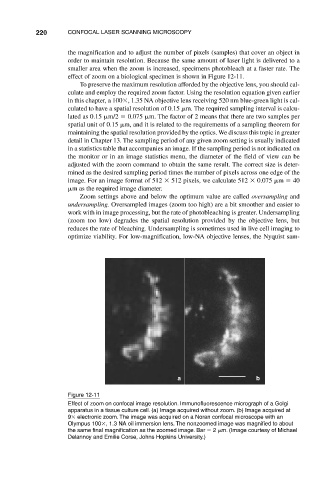
smaller area when the zoom is increased, specimens photobleach at a faster rate. The
effect of zoom on a biological specimen is shown in Figure 12-11.
To preserve the maximum resolution afforded by the objective lens, you should cal-
culate and employ the required zoom factor. Using the resolution equation given earlier
in this chapter, a 100 , 1.35 NA objective lens receiving 520 nm blue-green light is cal-
culated to have a spatial resolution of 0.15 m. The required sampling interval is calcu-
lated as 0.15 m/2 0.075 m. The factor of 2 means that there are two samples per
spatial unit of 0.15 m, and it is related to the requirements of a sampling theorem for
maintaining the spatial resolution provided by the optics. We discuss this topic in greater
detail in Chapter 13. The sampling period of any given zoom setting is usually indicated
in a statistics table that accompanies an image. If the sampling period is not indicated on
the monitor or in an image statistics menu, the diameter of the field of view can be
adjusted with the zoom command to obtain the same result. The correct size is deter-
mined as the desired sampling period times the number of pixels across one edge of the
image. For an image format of 512 512 pixels, we calculate 512 0.075 m 40
m as the required image diameter.
Zoom settings above and below the optimum value are called oversampling and
undersampling. Oversampled images (zoom too high) are a bit smoother and easier to
work with in image processing, but the rate of photobleaching is greater. Undersampling
(zoom too low) degrades the spatial resolution provided by the objective lens, but
reduces the rate of bleaching. Undersampling is sometimes used in live cell imaging to
optimize viability. For low-magnification, low-NA objective lenses, the Nyquist sam-
a b
Figure 12-11
Effect of zoom on confocal image resolution. Immunofluorescence micrograph of a Golgi
apparatus in a tissue culture cell. (a) Image acquired without zoom. (b) Image acquired at
9 electronic zoom. The image was acquired on a Noran confocal microscope with an
Olympus 100 , 1.3 NA oil immersion lens. The nonzoomed image was magnified to about
the same final magnification as the zoomed image. Bar 2 m. (Image courtesy of Michael
Delannoy and Emilie Corse, Johns Hopkins University.)