Page 328 - Fundamentals of Light Microscopy and Electronic Imaging
P. 328
RECORD KEEPING DURING IMAGE ACQUISITION AND PROCESSING        311


                          all of the image data contained in the original image histogram and display it
                          using the full range of gray-scale values from 0 to 255 using histogram stretching.
                          For example, in a bright-field image where the information might occupy a frac-
                          tion of the gray-scale range, you should bring in the white and black set sliders to
                          encompass the values contained in the histogram display. If contrast needs to be
                          improved, it is generally acceptable to eliminate signals corresponding to the top
                          and bottom 1% of the data values. Beyond that, you should consider using   scal-
                          ing. These operations are described in Chapter 15. If bright saturating features
                          (dead cells, precipitates) appear in the image, it is legitimate to determine the
                          value of the brightest features in the cell of interest, and stretch the image his-
                          togram based on the revised range of pixel values.
                          If regions of an image other than the principal object show dim fluorescence,
                          include them within the image histogram, because it is likely that there will be
                          similar intensities in the object of interest. If you exclude the unwanted intensities
                          by stretching the histogram, the image might look posterized, leaving extensive
                          black (or white) areas. This is one of the most frequent errors made in image pro-
                          cessing. It is rarely justifiable to remove visible features of the image by adjust-
                          ing the histogram just to make the picture look better. This is especially true when
                          you expect to see a signal in “unwanted” places because of the biology of the sys-
                          tem or the properties of immunofluorescence labeling (Fig. 16-1).
                        • Apply global processing operations conservatively. For routine image processing,
                          limit yourself to 5–10% of the estimated maximum capacity of image enhance-
                          ment filters such as   scaling, sharpening and blurring filters, and unsharp mask
                          operations. Fortunately, there are objective criteria for thinking about this. For
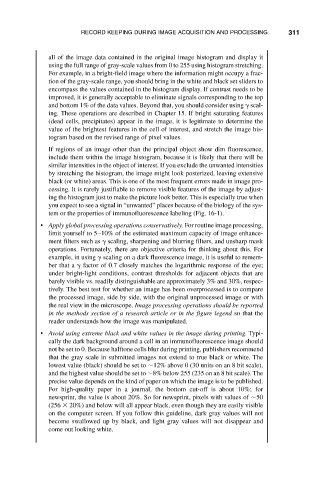
                          example, in using   scaling on a dark fluorescence image, it is useful to remem-
                          ber that a   factor of 0.7 closely matches the logarithmic response of the eye;
                          under bright-light conditions, contrast thresholds for adjacent objects that are
                          barely visible vs. readily distinguishable are approximately 3% and 30%, respec-
                          tively. The best test for whether an image has been overprocessed is to compare
                          the processed image, side by side, with the original unprocessed image or with
                          the real view in the microscope. Image processing operations should be reported
                          in the methods section of a research article or in the figure legend so that the
                          reader understands how the image was manipulated.

                        • Avoid using extreme black and white values in the image during printing. Typi-
                          cally the dark background around a cell in an immunofluorescence image should
                          not be set to 0. Because halftone cells blur during printing, publishers recommend
                          that the gray scale in submitted images not extend to true black or white. The
                          lowest value (black) should be set to  12% above 0 (30 units on an 8 bit scale),
                          and the highest value should be set to  8% below 255 (235 on an 8 bit scale). The
                          precise value depends on the kind of paper on which the image is to be published.
                          For high-quality paper in a journal, the bottom cut-off is about 10%; for
                          newsprint, the value is about 20%. So for newsprint, pixels with values of  50
                          (256   20%) and below will all appear black, even though they are easily visible
                          on the computer screen. If you follow this guideline, dark gray values will not
                          become swallowed up by black, and light gray values will not disappear and
                          come out looking white.

