
Page 191 - Fundamentals of Ocean Renewable Energy Generating Electricity From The Sea
P. 191
In Situ and Remote Methods for Resource Characterization Chapter | 7 179
convertors (WECs), because such devices should be aligned with the direction of
wave propagation for maximum efficiency. Further offshore, although the wave
climate will be characterized by a modal wave direction that tends to correspond
with the predominant wind direction, waves of different periods and heights
propagate from a wide range of directions, in an environment that may be more
suited to point absorber devices. However, nearer to the coastline, wave crests
that may have originated at oblique angles relative to the coastline in deeper
water tend to align themselves parallel to the coastline in the nearshore due to
wave refraction (Section 5.2.2). Therefore, a directional wave buoy located in
deeper water will generally record a much broader range of wave directions,
compared with a wave buoy that is located in shallower coastal waters.
Spectral characteristics: Because wave buoys, in contrast to tide gauges
(Section 7.1.1), sample changes in water surface elevation at HF, they can
report the spectral properties of waves. Different WECs are tuned to specific
parts of the wave energy spectrum. For example, the Pelamis device generates
electricity over a relatively wide range of wave parameters, but is optimal within
a particular range [19]. To match, or tune, a WEC to the local wave climate,
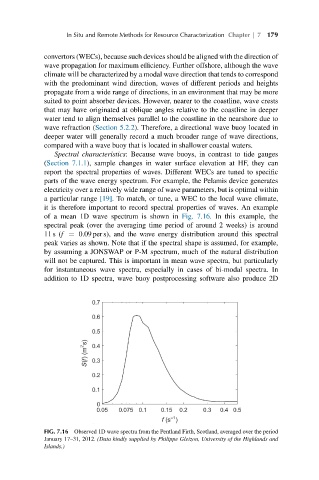
it is therefore important to record spectral properties of waves. An example
of a mean 1D wave spectrum is shown in Fig. 7.16. In this example, the
spectral peak (over the averaging time period of around 2 weeks) is around
11 s (f = 0.09 per s), and the wave energy distribution around this spectral
peak varies as shown. Note that if the spectral shape is assumed, for example,
by assuming a JONSWAP or P-M spectrum, much of the natural distribution
will not be captured. This is important in mean wave spectra, but particularly
for instantaneous wave spectra, especially in cases of bi-modal spectra. In
addition to 1D spectra, wave buoy postprocessing software also produce 2D
FIG. 7.16 Observed 1D wave spectra from the Pentland Firth, Scotland, averaged over the period
January 17–31, 2012. (Data kindly supplied by Philippe Gleizon, University of the Highlands and
Islands.)