
Page 135 - Fundamentals of Physical Volcanology
P. 135
9780632054435_4_008.qxd 12/10/2007 12:29PM Page 112
112 CHAPTER 8
(a)
1.0
2.5
5
10
Oskjuvatn
15 km
(b)
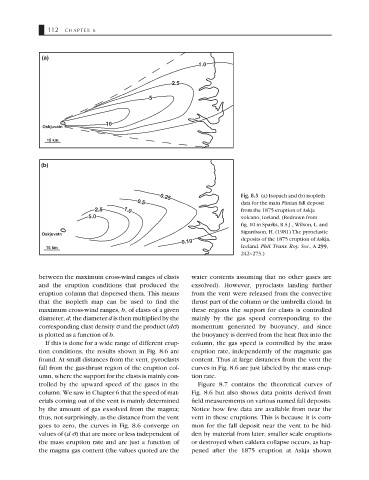
Fig. 8.5 (a) Isopach and (b) isopleth
0.25
0.5 data for the main Plinian fall deposit
2.5 1.0 from the 1875 eruption of Askja
5.0 volcano, Iceland. (Redrawn from
fig. 10 in Sparks, R.S.J., Wilson, L. and
Sigurdsson, H. (1981) The pyroclastic
Oskjuvatn
0.10 deposits of the 1875 eruption of Askja,
15 km Iceland. Phil. Trans. Roy. Soc., A 299,
242–273.)
between the maximum cross-wind ranges of clasts water contents assuming that no other gases are
and the eruption conditions that produced the exsolved). However, pyroclasts landing further
eruption column that dispersed them. This means from the vent were released from the convective
that the isopleth map can be used to find the thrust part of the column or the umbrella cloud. In
maximum cross-wind ranges, b, of clasts of a given these regions the support for clasts is controlled
diameter, d; the diameter d is then multiplied by the mainly by the gas speed corresponding to the
corresponding clast density σ and the product (dσ) momentum generated by buoyancy, and since
is plotted as a function of b. the buoyancy is derived from the heat flux into the
If this is done for a wide range of different erup- column, the gas speed is controlled by the mass
tion conditions, the results shown in Fig. 8.6 are eruption rate, independently of the magmatic gas
found. At small distances from the vent, pyroclasts content. Thus at large distances from the vent the
fall from the gas-thrust region of the eruption col- curves in Fig. 8.6 are just labeled by the mass erup-
umn, where the support for the clasts is mainly con- tion rate.
trolled by the upward speed of the gases in the Figure 8.7 contains the theoretical curves of
column. We saw in Chapter 6 that the speed of mat- Fig. 8.6 but also shows data points derived from
erials coming out of the vent is mainly determined field measurements on various named fall deposits.
by the amount of gas exsolved from the magma; Notice how few data are available from near the
thus, not surprisingly, as the distance from the vent vent in these eruptions. This is because it is com-
goes to zero, the curves in Fig. 8.6 converge on mon for the fall deposit near the vent to be hid-
values of (d σ) that are more or less independent of den by material from later, smaller scale eruptions
the mass eruption rate and are just a function of or destroyed when caldera collapse occurs, as hap-
the magma gas content (the values quoted are the pened after the 1875 eruption at Askja shown