
Page 136 - Fundamentals of Physical Volcanology
P. 136
9780632054435_4_008.qxd 12/10/2007 12:29PM Page 113
PYROCLASTIC FALLS AND PYROCLASTIC DENSITY CURRENTS 113
10 4
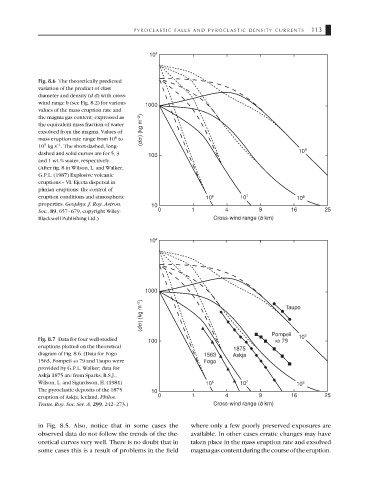
Fig. 8.6 The theoretically predicted
variation of the product of clast
diameter and density (d σ) with cross-
wind range b (see Fig. 8.2) for various 1000
values of the mass eruption rate and
the magma gas content, expressed as
the equivalent mass fraction of water
exsolved from the magma. Values of (d ) (kg m –2 )
6
mass eruption rate range from 10 to σ
−1
9
10 kg s . The short-dashed, long-
10 9
dashed and solid curves are for 5, 3 100
and 1 wt.% water, respectively.
(After fig. 8 in Wilson, L. and Walker,
G.P.L. (1987) Explosive volcanic
eruptions – VI. Ejecta dispersal in
plinian eruptions: the control of
eruption conditions and atmospheric 10 6 10 7 10 8
properties. Geophys. J. Roy. Astron. 10
Soc., 89, 657–679, copyright Wiley- 0 1 4 9 16 25
Blackwell Publishing Ltd.) Cross-wind range (b km)
10 4
1000
(d ) (kg m –2 ) σ Taupo
Pompeii 9
Fig. 8.7 Data for four well-studied 100 AD 79 10
eruptions plotted on the theoretical 1875
diagram of Fig. 8.6. (Data for Fogo 1563 Askja
1563, Pompeii AD 79 and Taupo were Fogo
provided by G.P.L. Walker; data for
Askja 1875 are from Sparks, R.S.J.,
Wilson, L. and Sigurdsson, H. (1981) 10 6 10 7 10 8
The pyroclastic deposits of the 1875 10
eruption of Askja, Iceland. Philos. 0 1 4 9 16 25
Trans. Roy. Soc. Ser. A, 299, 242–273.) Cross-wind range (b km)
in Fig. 8.5. Also, notice that in some cases the where only a few poorly preserved exposures are
observed data do not follow the trends of the the- available. In other cases erratic changes may have
oretical curves very well. There is no doubt that in taken place in the mass eruption rate and exsolved
some cases this is a result of problems in the field magma gas content during the course of the eruption.