
Page 235 - Fundamentals of Probability and Statistics for Engineers
P. 235
218 Fundamentals of Probability and Statistics for Engineers
7.4.1.2 Reliability and Exponential Failure Law
One can infer from our discussion on interarrival time that many analogous
situations can be treated by applying the exponential distribution. In reliability
studies, the time to failure for a physical component or a system is expected to
be exponentially distributed if the unit fails as soon as some single event, such
as malfunction of a component, occurs, assuming such events happen indepen-
dently. In order to gain more insight into failure processes, let us introduce
some basic notions in reliability.
Let random variable T be the time to failure of a component or system. It is
useful to consider a function that gives the probability of failure during a
small time increment, assuming that no failure occurred before that time. This
function, denoted by h(t), is called the hazard function or failure rate and is
defined by
h
tdt P
t < T t dtjT t
7:64
which gives
f
t
T
h
t :
7:65
1 F T
t
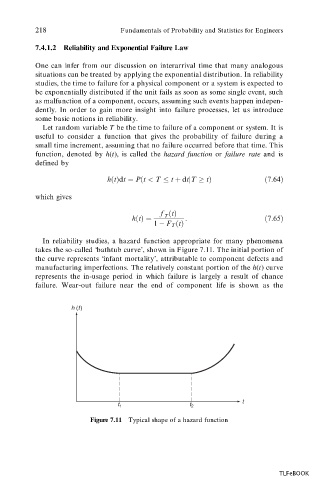
In reliability studies, a hazard function appropriate for many phenomena
takes the so-called ‘bathtub curve’, shown in Figure 7.11. The initial portion of
the curve represents ‘infant mortality’, attributable to component defects and
manufacturing imperfections. The relatively constant portion of the h(t) curve
represents the in-usage period in which failure is largely a result of chance
failure. Wear-out failure near the end of component life is shown as the
h (t)
t
t 1 t 2
Figure 7.11 Typical shape of a hazard function
TLFeBOOK