
Page 274 - Fundamentals of Probability and Statistics for Engineers
P. 274
Observed Data and Graphical Representation 257
10
9
8 7
Number of observations 6 5 4
3
2
1
0 2 4 6 8 10 12 14 16 18
Number of blemishes
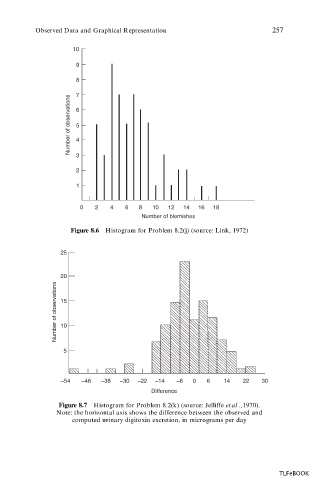
Figure 8.6 Histogram for Problem 8.2(j) (source: Link, 1972)
25
20
Number of observations 15
10
5
–54 –46 –38 –30 –22 –14 –6 0 6 14 22 30
Difference
Figure 8.7 Histogram for Problem 8.2(k) (source: Jelliffe et al ., 1970).
Note: the horizontal axis shows the difference between the observed and
computed urinary digitoxin excretion, in micrograms per day
TLFeBOOK