
Page 368 - Fundamentals of Probability and Statistics for Engineers
P. 368
Linear Models and Linear Regression 351
y
(x)
l 2
E(y) = ^ α + ^ x β
(x)
l 1
α ^ + β ^–
x
– x
x
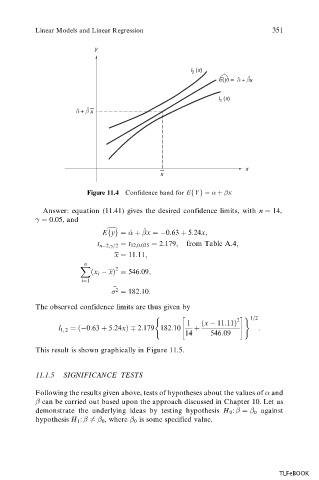
Figure 11.4 Confidence band for EfYg x
Answer: equation (11.41) gives the desired confidence limits, with n 14,
:
0 05, and
^
Efyg ^ x 0:63 5:24x;
d
t n 2;
=2 t 12;0:025 2:179; from Table A.4;
x 11:11;
n
X 2
x i x 546:09;
i1
b 2
182:10:
The observed confidence limits are thus given by
1=2
" 2 #)
1
x 11:11
l 1; 2
0:63 5:24x 2:179 182:10 :
14 546:09
This result is shown graphically in Figure 11.5.
11.1.5 SIGNIFICANCE TESTS
Following the results given above, tests of hypotheses about the values of and
can be carried out based upon the approach discussed in Chapter 10. Let us
demonstrate the underlying ideas by testing hypothesis H 0 : 0 against
:
hypothesis H 1 6 0 ,where 0 is some specified value.
TLFeBOOK