
Page 375 - Fundamentals of Probability and Statistics for Engineers
P. 375
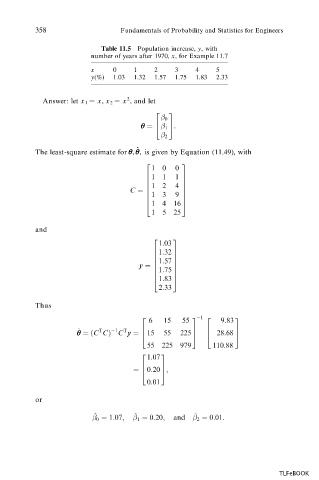
358 Fundamentals of Probability and Statistics for Engineers
Table 11.5 Population increase, y, with
number of years after 1970, x, for Example 11.7
x 0 1 2 3 4 5
y(%) 1.03 1.32 1.57 1.75 1.83 2.33
2
Answer: let x 1 x, x 2 x , and let
2 3
0
q 4 1 :
5
2
^
The least-square estimate for q, q, is given by Equation (11.49), with
2 3
1 0 0
1 1 1
6 7
6 7
1 2 4
6 7
C 6 7
1 3 9
6 7
6 7
4 1 4 16 5
1 5 25
and
1:03
2 3
1:32
6 7
6 7
1:57
6 7
y 6 7
1:75
6 7
6 7
1:83
4 5
2:33
Thus
6 15 55 9:83
2 3 1 2 3
^ T 1 T 6 7 6 7
q
C C C y 4 15 55 225 5 4 28:68 5
55 225 979 110:88
1:07
2 3
0:20 5;
6 7
4
0:01
or
^
^
^
0 1:07; 1 0:20; and 2 0:01:
TLFeBOOK