
Page 379 - Fundamentals of Probability and Statistics for Engineers
P. 379
362 Fundamentals of Probability and Statistics for Engineers
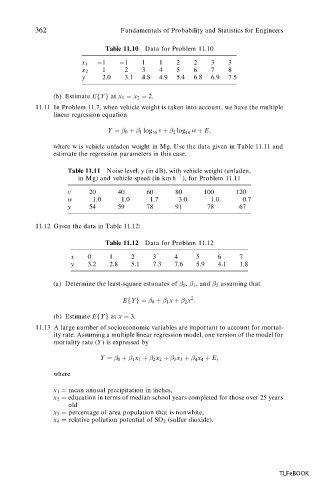
Table 11.10 Data for Problem 11.10
1 1 1 1 2 2 3 3
x 1
x 2 1 2 3 4 5 6 7 8
y 2.0 3.1 4.8 4.9 5.4 6.8 6.9 7.5
(b) Estimate EfYg at x 1 x 2 2.
11.11 In Problem 11.7, when vehicle weight is taken into account, we have the multiple
linear regression equation
Y 0 1 log v 2 log w E;
10
10
where w is vehicle unladen weight in Mg. Use the data given in Table 11.11 and
estimate the regression parameters in this case.
Table 11.11 Noise level, y (in dB), with vehicle weight (unladen,
1
in Mg) and vehicle speed (in km h ), for Problem 11.11
v 20 40 60 80 100 120
w 1.0 1.0 1.7 3.0 1.0 0.7
y 54 59 78 91 78 67
11.12 Given the data in Table 11.12:
Table 11.12 Data for Problem 11.12
x 0 1 2 3 4 5 6 7
y 3.2 2.8 5.1 7.3 7.6 5.9 4.1 1.8
(a) Determine the least-square estimates of 1 ,and 2 assuming that
0 ,
2
EfYg 0 1 x 2 x :
(b) Estimate EfYg at x 3.
11.13 A large number of socioeconomic variables are important to account for mortal-
ity rate. Assuming a multiple linear regression model, one version of the model for
mortality rate (Y ) is expressed by
Y 0 1 x 1 2 x 2 3 x 3 4 x 4 E;
where
x 1 mean annual precipitation in inches,
x 2 education in terms of median school years completed for those over 25 years
old
x 3 percentage of area population that is nonwhite,
x 4 relative pollution potential of SO 2 (sulfur dioxide).
TLFeBOOK