
Page 378 - Fundamentals of Probability and Statistics for Engineers
P. 378
Linear Models and Linear Regression 361
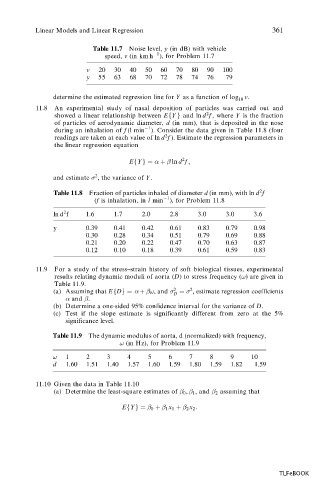
Table 11.7 Noise level, y (in dB) with vehicle
1
speed, v (in km h ), for Problem 11.7
v 20 30 40 50 60 70 80 90 100
y 55 63 68 70 72 78 74 76 79
determine the estimated regression line for Y as a function of log v.
10
11.8 An experimental study of nasal deposition of particles was carried out and
2
showed a linear relationship between E Y and ln d f , where Y is the fraction
f g
of particles of aerodynamic diameter, d (in mm), that is deposited in the nose
1
during an inhalation of f (l min ). Consider the data given in Table 11.8 (four
2
readings are taken at each value of ln d f ). Estimate the regression parameters in
the linear regression equation
2
EfYg ln d f ;
and estimate 2 , the variance of Y .
Table 11.8 Fraction of particles inhaled of diameter d (in mm), with ln d f
2
1
(f is inhalation, in l min ), for Problem 11.8
2
ln d f 1.6 1.7 2.0 2.8 3.0 3.0 3.6
y 0.39 0.41 0.42 0.61 0.83 0.79 0.98
0.30 0.28 0.34 0.51 0.79 0.69 0.88
0.21 0.20 0.22 0.47 0.70 0.63 0.87
0.12 0.10 0.18 0.39 0.61 0.59 0.83
11.9 For a study of the stress–strain history of soft biological tissues, experimental
!
results relating dynamic moduli of aorta (D) to stress frequency ( ) are given in
Table 11.9.
2
2
f
(a) Assuming that E Dg ! , and , , estimate regression coefficients
D
and .
(b) Determine a one-sided 95% confidence interval for the variance of D.
(c) Test if the slope estimate is significantly different from zero at the 5%
significance level.
Table 11.9 The dynamic modulus of aorta, d (normalized) with frequency,
! (in Hz), for Problem 11.9
! 1 2 3 4 5 6 7 8 9 10
d 1.60 1.51 1.40 1.57 1.60 1.59 1.80 1.59 1.82 1.59
11.10 Given the data in Table 11.10
(a) Determine the least-square estimates of 0 , 1 , ,and 2 assuming that
EfYg 0 1 x 1 2 x 2 :
TLFeBOOK