
Page 124 - Fundamentals of Radar Signal Processing
P. 124
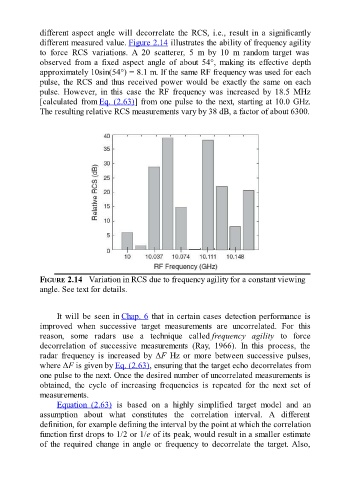
different  aspect  angle  will  decorrelate  the  RCS,  i.e.,  result  in  a  significantly

               different measured value. Figure 2.14 illustrates the ability of frequency agility
               to  force  RCS  variations.  A  20  scatterer,  5  m  by  10  m  random  target  was
               observed  from  a  fixed  aspect  angle  of  about  54°,  making  its  effective  depth
               approximately 10sin(54°) = 8.1 m. If the same RF frequency was used for each
               pulse,  the  RCS  and  thus  received  power  would  be  exactly  the  same  on  each
               pulse.  However,  in  this  case  the  RF  frequency  was  increased  by  18.5  MHz

               [calculated  from Eq. (2.63)] from one pulse to the next, starting at 10.0 GHz.
               The resulting relative RCS measurements vary by 38 dB, a factor of about 6300.


               FIGURE 2.14   Variation in RCS due to frequency agility for a constant viewing
               angle. See text for details.


                     It  will  be  seen  in Chap. 6 that in certain cases detection performance is
               improved  when  successive  target  measurements  are  uncorrelated.  For  this
               reason,  some  radars  use  a  technique  called frequency  agility  to  force
               decorrelation  of  successive  measurements  (Ray,  1966).  In  this  process,  the
               radar  frequency  is  increased  by  ΔF  Hz  or  more  between  successive  pulses,
               where ΔF is given by Eq. (2.63), ensuring that the target echo decorrelates from

               one pulse to the next. Once the desired number of uncorrelated measurements is
               obtained,  the  cycle  of  increasing  frequencies  is  repeated  for  the  next  set  of
               measurements.
                     Equation  (2.63)  is  based  on  a  highly  simplified  target  model  and  an
               assumption  about  what  constitutes  the  correlation  interval.  A  different
               definition, for example defining the interval by the point at which the correlation
               function first drops to 1/2 or 1/e of its peak, would result in a smaller estimate

               of  the  required  change  in  angle  or  frequency  to  decorrelate  the  target. Also,