
Page 134 - Fundamentals of Radar Signal Processing
P. 134
0
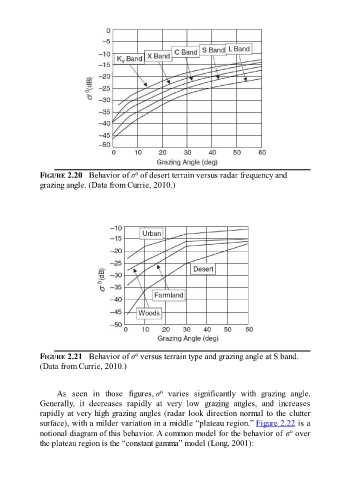
FIGURE 2.20 Behavior of σ of desert terrain versus radar frequency and
grazing angle. (Data from Currie, 2010.)
0
FIGURE 2.21 Behavior of σ versus terrain type and grazing angle at S band.
(Data from Currie, 2010.)
0
As seen in those figures, σ varies significantly with grazing angle.
Generally, it decreases rapidly at very low grazing angles, and increases
rapidly at very high grazing angles (radar look direction normal to the clutter
surface), with a milder variation in a middle “plateau region.” Figure 2.22 is a
0
notional diagram of this behavior. A common model for the behavior of σ over
the plateau region is the “constant gamma” model (Long, 2001):