
Page 130 - Fundamentals of Radar Signal Processing
P. 130
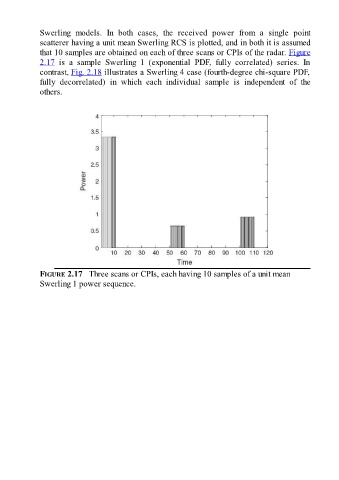
Swerling  models.  In  both  cases,  the  received  power  from  a  single  point

               scatterer having a unit mean Swerling RCS is plotted, and in both it is assumed
               that 10 samples are obtained on each of three scans or CPIs of the radar. Figure
               2.17  is  a  sample  Swerling  1  (exponential  PDF,  fully  correlated)  series.  In
               contrast, Fig. 2.18 illustrates a Swerling 4 case (fourth-degree chi-square PDF,
               fully  decorrelated)  in  which  each  individual  sample  is  independent  of  the
               others.


               FIGURE 2.17   Three scans or CPIs, each having 10 samples of a unit mean

               Swerling 1 power sequence.