
Page 299 - Fundamentals of Radar Signal Processing
P. 299
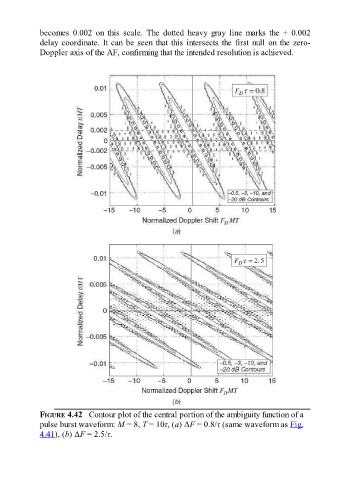
becomes  0.002  on  this  scale.  The  dotted  heavy  gray  line  marks  the  +  0.002

               delay coordinate. It can be seen that this intersects the first null on the zero-
               Doppler axis of the AF, confirming that the intended resolution is achieved.


               FIGURE 4.42   Contour plot of the central portion of the ambiguity function of a
               pulse burst waveform: M = 8, T = 10τ, (a) ΔF = 0.8/τ (same waveform as Fig.
               4.41), (b) ΔF = 2.5/τ.