
Page 38 - Fundamentals of Radar Signal Processing
P. 38
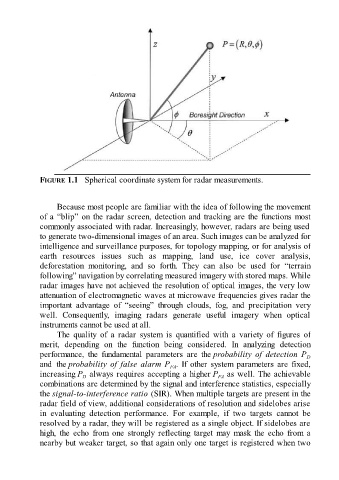
FIGURE 1.1   Spherical coordinate system for radar measurements.


                     Because most people are familiar with the idea of following the movement
               of a “blip” on the radar screen, detection and tracking are the functions most
               commonly associated with radar. Increasingly, however, radars are being used
               to generate two-dimensional images of an area. Such images can be analyzed for
               intelligence and surveillance purposes, for topology mapping, or for analysis of
               earth  resources  issues  such  as  mapping,  land  use,  ice  cover  analysis,

               deforestation  monitoring,  and  so  forth.  They  can  also  be  used  for  “terrain
               following” navigation by correlating measured imagery with stored maps. While
               radar images have not achieved the resolution of optical images, the very low
               attenuation of electromagnetic waves at microwave frequencies gives radar the
               important  advantage  of  “seeing”  through  clouds,  fog,  and  precipitation  very
               well.  Consequently,  imaging  radars  generate  useful  imagery  when  optical
               instruments cannot be used at all.

                     The  quality  of  a  radar  system  is  quantified  with  a  variety  of  figures  of
               merit,  depending  on  the  function  being  considered.  In  analyzing  detection
               performance,  the  fundamental  parameters  are  the probability  of  detection  P            D
               and  the probability of false alarm P . If other system parameters are fixed,
                                                             FA
               increasing P  always requires accepting a higher P  as well. The achievable
                                                                              FA
                              D
               combinations are determined by the signal and interference statistics, especially
               the signal-to-interference ratio (SIR). When multiple targets are present in the
               radar field of view, additional considerations of resolution and sidelobes arise
               in  evaluating  detection  performance.  For  example,  if  two  targets  cannot  be
               resolved by a radar, they will be registered as a single object. If sidelobes are
               high,  the  echo  from  one  strongly  reflecting  target  may  mask  the  echo  from  a
               nearby but weaker target, so that again only one target is registered when two