
Page 454 - Fundamentals of Radar Signal Processing
P. 454
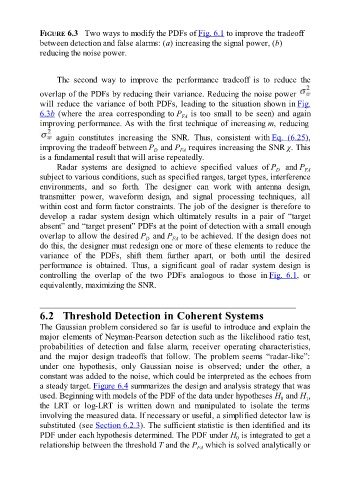
FIGURE 6.3   Two ways to modify the PDFs of Fig. 6.1 to improve the tradeoff
               between detection and false alarms: (a) increasing the signal power, (b)
               reducing the noise power.


                     The  second  way  to  improve  the  performance  tradeoff  is  to  reduce  the

               overlap of the PDFs by reducing their variance. Reducing the noise power
               will reduce the variance of both PDFs, leading to the situation shown in Fig.
               6.3b (where the area corresponding to P  is too small to be seen) and again
                                                                 FA
               improving performance. As with the first technique of increasing m, reducing


                     again  constitutes  increasing  the  SNR.  Thus,  consistent  with Eq.  (6.25),
               improving the tradeoff between P  and P  requires increasing the SNR χ. This
                                                       D
                                                                FA
               is a fundamental result that will arise repeatedly.
                     Radar  systems  are  designed  to  achieve  specified  values  of P   and P            FA
                                                                                                  D
               subject to various conditions, such as specified ranges, target types, interference
               environments,  and  so  forth.  The  designer  can  work  with  antenna  design,
               transmitter  power,  waveform  design,  and  signal  processing  techniques,  all
               within cost and form factor constraints. The job of the designer is therefore to

               develop  a  radar  system  design  which  ultimately  results  in  a  pair  of  “target
               absent” and “target present” PDFs at the point of detection with a small enough
               overlap to allow the desired P  and P  to be achieved. If the design does not
                                                             FA
                                                    D
               do this, the designer must redesign one or more of these elements to reduce the
               variance  of  the  PDFs,  shift  them  further  apart,  or  both  until  the  desired

               performance  is  obtained.  Thus,  a  significant  goal  of  radar  system  design  is
               controlling  the  overlap  of  the  two  PDFs  analogous  to  those  in Fig.  6.1,  or
               equivalently, maximizing the SNR.


               6.2   Threshold Detection in Coherent Systems

               The Gaussian problem considered so far is useful to introduce and explain the
               major elements of Neyman-Pearson detection such as the likelihood ratio test,
               probabilities  of  detection  and  false  alarm,  receiver  operating  characteristics,
               and  the  major  design  tradeoffs  that  follow.  The  problem  seems  “radar-like”:

               under  one  hypothesis,  only  Gaussian  noise  is  observed;  under  the  other,  a
               constant was added to the noise, which could be interpreted as the echoes from
               a steady target. Figure 6.4 summarizes the design and analysis strategy that was
               used. Beginning with models of the PDF of the data under hypotheses H  and H ,
                                                                                                    0
                                                                                                            1
               the  LRT  or  log-LRT  is  written  down  and  manipulated  to  isolate  the  terms
               involving the measured data. If necessary or useful, a simplified detector law is
               substituted (see Section 6.2.3). The sufficient statistic is then identified and its

               PDF under each hypothesis determined. The PDF under H  is integrated to get a
                                                                                    0
               relationship between the threshold T and the P  which is solved analytically or
                                                                      FA