
Page 455 - Fundamentals of Radar Signal Processing
P. 455
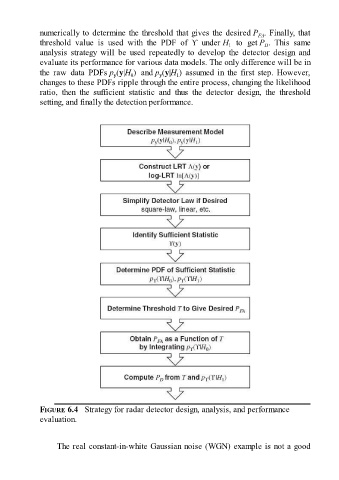
numerically to determine the threshold that gives the desired P . Finally, that
                                                                                            FA
               threshold  value  is  used  with  the  PDF  of  ϒ  under H   to  get P .  This  same
                                                                                              D
                                                                                 1
               analysis  strategy  will  be  used  repeatedly  to  develop  the  detector  design  and
               evaluate its performance for various data models. The only difference will be in
               the  raw  data  PDFs p (y|H )  and p (y|H ) assumed in the first step. However,
                                                               1
                                         y
                                                         y
                                               0
               changes to these PDFs ripple through the entire process, changing the likelihood
               ratio,  then  the  sufficient  statistic  and  thus  the  detector  design,  the  threshold
               setting, and finally the detection performance.


               FIGURE 6.4   Strategy for radar detector design, analysis, and performance
               evaluation.


                     The real constant-in-white Gaussian noise (WGN) example is not a good