
Page 466 - Fundamentals of Radar Signal Processing
P. 466
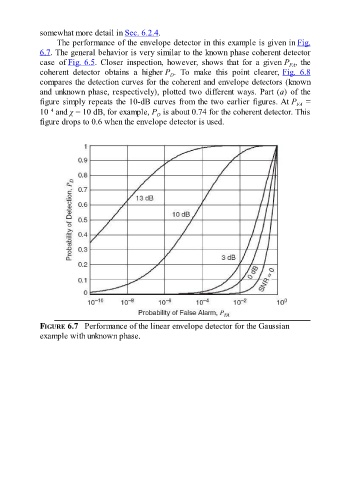
somewhat more detail in Sec. 6.2.4.

                     The performance of the envelope detector in this example is given in Fig.
               6.7. The general behavior is very similar to the known phase coherent detector
               case  of Fig. 6.5.  Closer  inspection,  however,  shows  that  for  a  given P , the
                                                                                                       FA
               coherent  detector  obtains  a  higher P .  To  make  this  point  clearer, Fig.  6.8
                                                             D
               compares the detection curves for the coherent and envelope detectors (known
               and unknown phase, respectively), plotted two different ways. Part (a) of the

               figure simply repeats the 10-dB curves from the two earlier figures. At P  =
                                                                                                         FA
                  –4
               10  and χ = 10 dB, for example, P  is about 0.74 for the coherent detector. This
                                                        D
               figure drops to 0.6 when the envelope detector is used.


               FIGURE 6.7   Performance of the linear envelope detector for the Gaussian
               example with unknown phase.