
Page 467 - Fundamentals of Radar Signal Processing
P. 467
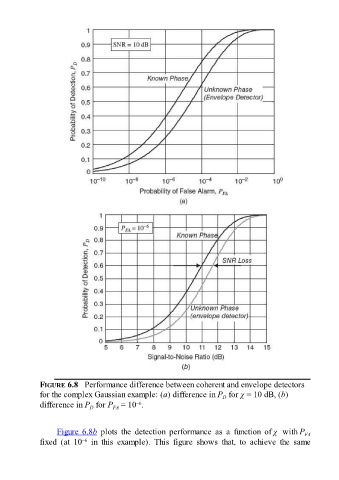
FIGURE 6.8   Performance difference between coherent and envelope detectors
               for the complex Gaussian example: (a) difference in P  for χ = 10 dB, (b)
                                                                               D
                                                 –6
               difference in P  for P  = 10 .
                                 D
                                         FA

                     Figure 6.8b  plots  the  detection  performance  as  a  function  of χ  with P         FA
               fixed  (at  10   in  this  example).  This  figure  shows  that,  to  achieve  the  same
                              –6