
Page 229 - Fundamentals of Reservoir Engineering
P. 229
OILWELL TESTING 167
p D = ½ (2.303 log t D + 0.809)
= 1.151 log t D + 0.405
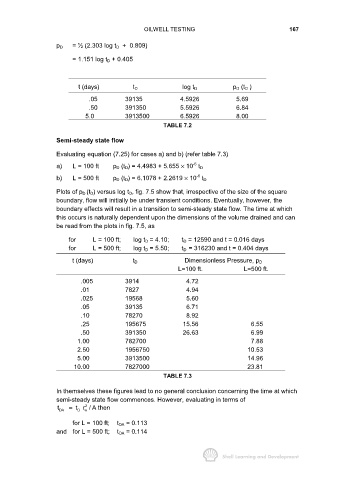
t (days) t D log t D p D (t D )
.05 39135 4.5926 5.69
.50 391350 5.5926 6.84
5.0 3913500 6.5926 8.00
TABLE 7.2
Semi-steady state flow
Evaluating equation (7.25) for cases a) and b) (refer table 7.3)
-5
a) L = 100 ft p D (t D) = 4.4983 + 5.655 × 10 t D
-6
b) L = 500 ft p D (t D) = 6.1078 + 2.2619 × 10 t D
Plots of p D (t D) versus log t D, fig. 7.5 show that, irrespective of the size of the square
boundary, flow will initially be under transient conditions. Eventually, however, the
boundary effects will result in a transition to semi-steady state flow. The time at which
this occurs is naturally dependent upon the dimensions of the volume drained and can
be read from the plots in fig. 7.5, as
for L = 100 ft; log t D = 4.10; t D = 12590 and t = 0.016 days
for L = 500 ft; log t D = 5.50; t D = 316230 and t = 0.404 days
t (days) t D Dimensionless Pressure, p D
L=100 ft. L=500 ft.
.005 3914 4.72
.01 7827 4.94
.025 19568 5.60
.05 39135 6.71
.10 78270 8.92
.25 195675 15.56 6.55
.50 391350 26.63 6.99
1.00 782700 7.88
2.50 1956750 10.53
5.00 3913500 14.96
10.00 7827000 23.81
TABLE 7.3
In themselves these figures lead to no general conclusion concerning the time at which
semi-steady state flow commences. However, evaluating in terms of
2
t = t r / A then
w
D
DA
for L = 100 ft; t DA = 0.113
and for L = 500 ft; t DA = 0.114