
Page 233 - Fundamentals of Reservoir Engineering
P. 233
OILWELL TESTING 171
function of the flowing time t to yield the basic reservoir parameters k, S, A and C A. The
most common form of analysis used has already been fully described in exercise 7.2. It
is assumed that the initial equilibrium pressure p i is known and this is simply the
recorded pressure prior to opening the well in the first place.
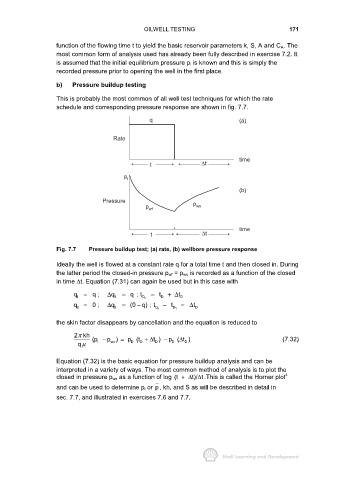
b) Pressure buildup testing
This is probably the most common of all well test techniques for which the rate
schedule and corresponding pressure response are shown in fig. 7.7.
q (a)
Rate
time
t ∆t
p i
(b)
Pressure p
p wf ws
time
t ∆t
Fig. 7.7 Pressure buildup test; (a) rate, (b) wellbore pressure response
Ideally the well is flowed at a constant rate q for a total time t and then closed in. During
the latter period the closed-in pressure p wf = p ws is recorded as a function of the closed
in time ∆t. Equation (7.31) can again be used but in this case with
q 1 = q ; ∆ q 1 = q ; t D n = t D + t ∆ D
−
q = 0 ; ∆ q 2 = (0 q) ; t D n − t D 1 = t ∆ D
2
the skin factor disappears by cancellation and the equation is reduced to
2kh
π
∆
−
−
(p p ) = p (t + ∆ t ) p ( t ) (7.32)
D
D
D
D
D
ws
i
qµ
Equation (7.32) is the basic equation for pressure buildup analysis and can be
interpreted in a variety of ways. The most common method of analysis is to plot the
closed in pressure p ws as a function of log (t +∆ t)/ t .This is called the Horner plot 4
∆
and can be used to determine p i or p, kh, and S as will be described in detail in
sec. 7.7, and illustrated in exercises 7.6 and 7.7.