
Page 253 - Fundamentals of Reservoir Engineering
P. 253
OILWELL TESTING 190
observed data
equation (7.48) p*
m
p ws
(psi) p ws(LIN) I − hr
small ∆t large ∆t
4 3 2 1 0
t +∆t
log
∆t
10000 1000 100 10 1
t +∆ t
∆ t
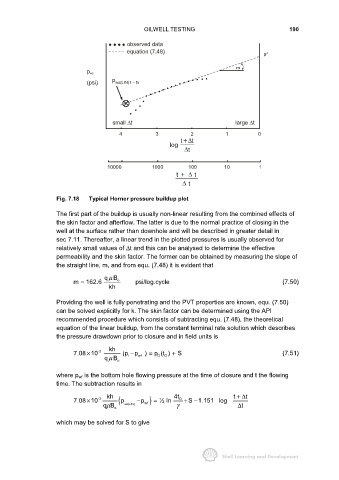
Fig. 7.18 Typical Horner pressure buildup plot
The first part of the buildup is usually non-linear resulting from the combined effects of
the skin factor and afterflow. The latter is due to the normal practice of closing in the
well at the surface rather than downhole and will be described in greater detail in
sec 7.11. Thereafter, a linear trend in the plotted pressures is usually observed for
relatively small values of ∆t and this can be analysed to determine the effective
permeability and the skin factor. The former can be obtained by measuring the slope of
the straight line, m, and from equ. (7.48) it is evident that
qB
µ
m = 162.6 o psi/log.cycle (7.50)
kh
Providing the well is fully penetrating and the PVT properties are known, equ. (7.50)
can be solved explicitly for k. The skin factor can be determined using the API
recommended procedure which consists of subtracting equ. (7.48), the theoretical
equation of the linear buildup, from the constant terminal rate solution which describes
the pressure drawdown prior to closure and in field units is
kh
7.08 10 -3 (p − p ) = p (t ) + S (7.51)
×
qB o i wf D D
µ
where p wf is the bottom hole flowing pressure at the time of closure and t the flowing
time. The subtraction results in
kh 4t t +∆ t
7.08 10 -3 ( p − p ) = ½ ln D + S 1.151 log
−
×
qB o ws(LIN) wf γ t ∆
µ
which may be solved for S to give