
Page 309 - Fundamentals of Reservoir Engineering
P. 309
REAL GAS FLOW: GAS WELL TESTING 245
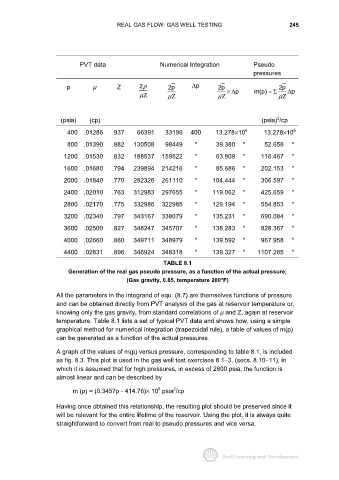
PVT data Numerical Integration Pseudo
pressures
p µ Z 2ρ 2p ∆ p 2p 2p
×∆ p m(p) =Σ ∆ p
µΖ µΖ µΖ µΖ
2
(psia) (cp) (psia) /cp
400 .01286 .937 66391 33196 400 13.278×10 6 13.278×10 6
800 .01390 .882 130508 98449 " 39.380 " 52.658 "
1200 .01530 .832 188537 159522 " 63.809 " 116.467 "
1600 .01680 .794 239894 214216 " 85.686 " 202.153 "
2000 .01840 .770 282326 261110 " 104.444 " 306.597 "
2400 .02010 .763 312983 297655 " 119.062 " 425.659 "
2800 .02170 .775 332986 322985 " 129.194 " 554.853 "
3200 .02340 .797 343167 338079 " 135.231 " 690.084 "
3600 .02500 .827 348247 345707 " 138.283 " 828.367 "
4000 .02660 .860 349711 348979 " 139.592 " 967.958 "
4400 .02831 .896 346924 348318 " 139.327 " 1107.285 "
TABLE 8.1
Generation of the real gas pseudo pressure, as a function of the actual pressure;
(Gas gravity, 0.85, temperature 200°F)
All the parameters in the integrand of equ. (8.7) are themselves functions of pressure
and can be obtained directly from PVT analysis of the gas at reservoir temperature or,
knowing only the gas gravity, from standard correlations of µ and Z, again at reservoir
temperature. Table 8.1 lists a set of typical PVT data and shows how, using a simple
graphical method for numerical integration (trapezoidal rule), a table of values of m(p)
can be generated as a function of the actual pressures.
A graph of the values of m(p) versus pressure, corresponding to table 8.1, is included
as fig. 8.3. This plot is used in the gas well test exercises 8.1−3, (secs. 8.10−11), in
which it is assumed that for high pressures, in excess of 2800 psia, the function is
almost linear and can be described by
2
6
m (p) = (0.3457p - 414.76)× 10 psia /cp
Having once obtained this relationship, the resulting plot should be preserved since it
will be relevant for the entire lifetime of the reservoir. Using the plot, it is always quite
straightforward to convert from real to pseudo pressures and vice versa.