
Page 98 - Fundamentals of Reservoir Engineering
P. 98
SOME BASIC CONCEPTS IN RESERVOIR ENGINEERING 37
Τ
βγ g Q 2
∆ m () p = 3.161 × 10 − 12 = FQ 2
2
nD hr
µ wp w
1.8 HYDROCARBON PHASE BEHAVIOUR
This subject has been covered extensively in specialist books 8,13,18 and is described
here in a somewhat perfunctory manner simply to provide a qualitative understanding
of the difference between various hydrocarbon systems as they exist in the reservoir.
Consider, first of all, the simple experiment in which a cylinder containing one of the
lighter members of the paraffin series, C 2 H 6−ethane, is subjected to a continuously
increasing pressure at constant temperature. At some unique pressure (the vapour
pressure) during this experiment the C 2 H 6, which was totally in the gas phase at low
pressures will condense into a liquid. If this experiment were repeated at a series of
different temperatures the resulting phase diagram, which is the pressure temperature
relationship, could be drawn as shown in fig. 1.14(a).
CP 50% - C 2 H 6
100% - C 2 H 6 100% - C 7 H 16
LIQUID 50% - C 7 H 16
P CP P P LIQUID
LIQUID +
GAS
LIQUID CP
GAS
GAS GAS
T T T
( a ) ( b ) ( c )
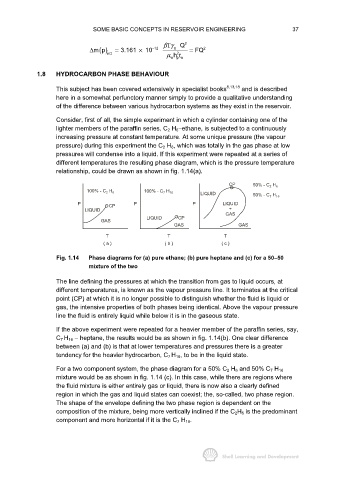
Fig. 1.14 Phase diagrams for (a) pure ethane; (b) pure heptane and (c) for a 50− −− −50
mixture of the two
The line defining the pressures at which the transition from gas to liquid occurs, at
different temperatures, is known as the vapour pressure line. It terminates at the critical
point (CP) at which it is no longer possible to distinguish whether the fluid is liquid or
gas, the intensive properties of both phases being identical. Above the vapour pressure
line the fluid is entirely liquid while below it is in the gaseous state.
If the above experiment were repeated for a heavier member of the paraffin series, say,
C 7 H 16 − heptane, the results would be as shown in fig. 1.14(b). One clear difference
between (a) and (b) is that at lower temperatures and pressures there is a greater
tendency for the heavier hydrocarbon, C 7 H 16, to be in the liquid state.
For a two component system, the phase diagram for a 50% C 2 H 6 and 50% C 7 H 16
mixture would be as shown in fig. 1.14 (c). In this case, while there are regions where
the fluid mixture is either entirely gas or liquid, there is now also a clearly defined
region in which the gas and liquid states can coexist; the, so-called, two phase region.
The shape of the envelope defining the two phase region is dependent on the
composition of the mixture, being more vertically inclined if the C 2H 6 is the predominant
component and more horizontal if it is the C 7 H 16.