Page 175 - Fundamentals of The Finite Element Method for Heat and Fluid Flow
P. 175

TRANSIENT HEAT CONDUCTION ANALYSIS
                                        0.5 T = −45.0°C    Insulated     T l  = −0.15°C       167
                                                      T s  = −10.15°C
                                                           4

                                      Figure 6.14 A one-dimensional solidification problem


                        side face is subjected to a liquidus temperature of −0.15 C. The solidus temperature is
                                                                        ◦
                              ◦
                        −10.15 C. Determine the temperature distribution with respect to time if the latent heat of
                        solidification is 70.26, ρc p = 1.0 and k = 1.0. Draw the temperature variation at a distance
                        of unity from the left side with respect to time.
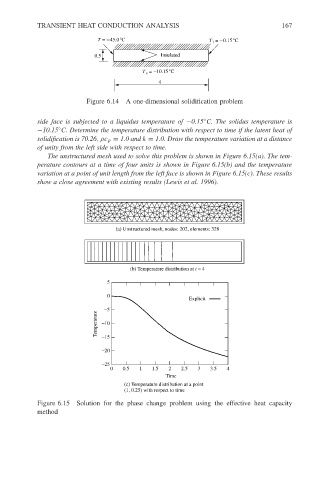
                           The unstructured mesh used to solve this problem is shown in Figure 6.15(a). The tem-
                        perature contours at a time of four units is shown in Figure 6.15(b) and the temperature
                        variation at a point of unit length from the left face is shown in Figure 6.15(c). These results
                        show a close agreement with existing results (Lewis et al. 1996).


                                              (a) Unstructured mesh, nodes: 202, elements: 328


                                                  (b) Temperature distribution at t = 4
                                            5

                                            0
                                                                   Explicit
                                           −5
                                         Temperature  −10


                                          −15

                                          −20
                                          −25
                                             0  0.5  1   1.5  2  2.5  3   3.5  4
                                                             Time
                                                 (c) Temperature distribution at a point
                                                 (1, 0.25) with respect to time
                        Figure 6.15 Solution for the phase change problem using the effective heat capacity
                        method
   170   171   172   173   174   175   176   177   178   179   180