
Page 240 - Fundamentals of Water Treatment Unit Processes : Physical, Chemical, and Biological
P. 240
Coagulation 195
TABLE 9.2
Turbidity and Particle Counts for Various Water Treatment Plants
Turbidity
Particle Counts
Influent Effluent Influent Effluent
Location Plant (NTU) (NTU) (#=mL) (#=mL)
Tuscaloosa, Alabama Ed Love WTP 1.2 0.07 17,000 540
Glendale, Ariz Cholla WTP 4.4 0.04 69,000 590
Contra Costa, California a R. D. Bollman WTP 9.0 0.05 179,000 290
Loveland, Colorado Chasteens Grove 1.5 0.03 11,000 120
Winnetka, Illinois Winnetka WTP 49.0 0.01 500,000 500
Diluth, Minnesota Lakewood WTP 0.4 0.02 4,000 41
Merrifield, Virgina b Corbalis WTP 10.0 0.03 51,000 210
Los Angeles, California c LA Aqueduct WTP 3.6 0.07 55,000 630
Las Vegas, Nevada d A. M. Smith WTP 0.2 0.06 3,200 290
East Bay MUD, California e Orinda WTP 0.4 0.06 8,800 720
Source: Adapted from Cleasby, J.L. et al., Design and Operation Guidelines for Optimization of the High-Rate Filtration
Process: Plant Survey Results, AWWA Research Foundation, Denver, CO, September 1989, pp. 73–74.
a
Source water is from the Sacramento—San Joaquin River Delta; peak raw water turbidity 80 NTU, DOC 11 mg=L,
seasonally high plankton populations up to 50,000 organisms=mL.
b
Source is Potomac River with peak turbidity 180 NTU and peak color 100 apparent color units.
c
Source is Owens River, carried by pipeline to Los Angeles.
d
Source is Lake Mead.
e
Source is Calaveras River, Sierra Nevada mountains.
20 50
40
15
Turbidity (NTU) 10 Alkalinity (mg/L) 30
20
5
10
0 0
J F M A M J J A S O N D J F M A M J J A S O N D
(a) Month (b) Month
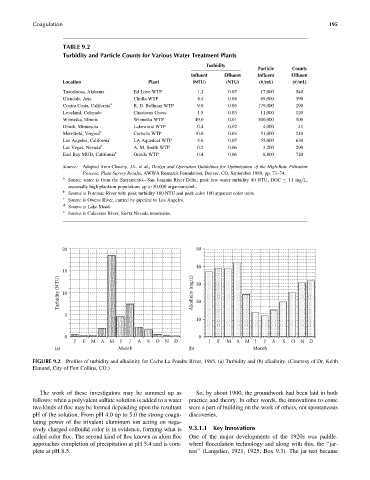
FIGURE 9.2 Profiles of turbidity and alkalinity for Cache La Poudre River, 1985. (a) Turbidity and (b) alkalinity. (Courtesy of Dr. Keith
Elmund, City of Fort Collins, CO.)
The work of these investigators may be summed up as So, by about 1900, the groundwork had been laid in both
follows: when a polyvalent sulfate solution is added to a water practice and theory. In other words, the innovations to come
two kinds of floc may be formed depending upon the resultant were a part of building on the work of others, not spontaneous
pH of the solution. From pH 4.0 up to 5.0 the strong coagu- discoveries.
lating power of the trivalent aluminum ion acting on nega-
tively charged colloidal color is in evidence, forming what is 9.3.1.1 Key Innovations
called color floc. The second kind of floc known as alum floc One of the major developments of the 1920s was paddle-
approaches completion of precipitation at pH 5.4 and is com- wheel flocculation technology and along with this, the ‘‘jar-
plete at pH 8.5. test’’ (Langelier, 1921, 1925; Box 9.3). The jar-test became