
Page 243 - Fundamentals of Water Treatment Unit Processes : Physical, Chemical, and Biological
P. 243
198 Fundamentals of Water Treatment Unit Processes: Physical, Chemical, and Biological
113 Microns
50 Microns
Floc Particle with Trapped Diatom 200 X Grant Jones 12/10/2009
Floc Particle with Trapped Diatom 200 X Grant Jones 12/10/2009
(a) (b)
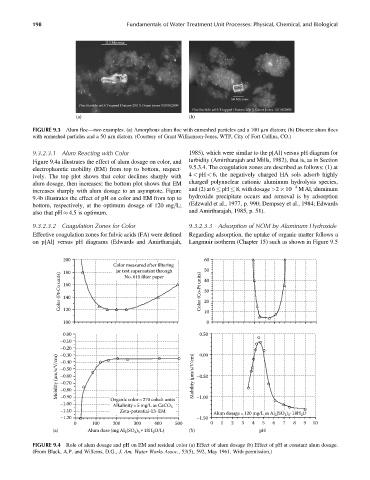
FIGURE 9.3 Alum floc—two examples. (a) Amorphous alum floc with enmeshed particles and a 100 mm diatom; (b) Discrete alum flocs
with enmeshed particles and a 50 mm diatom. (Courtesy of Grant Williamson-Jones, WTP, City of Fort Collins, CO.)
9.3.2.3.1 Alum Reacting with Color 1985), which were similar to the p[Al] versus pH diagram for
Figure 9.4a illustrates the effect of alum dosage on color, and turbidity (Amirtharajah and Mills, 1982), that is, as in Section
electrophoretic mobility (EM) from top to bottom, respect- 9.5.3.4. The coagulation zones are described as follows: (1) at
ively. The top plot shows that color declines sharply with 4 < pH < 6, the negatively charged HA sols adsorb highly
alum dosage, then increases; the bottom plot shows that EM charged polynuclear cationic aluminum hydrolysis species,
4
increases sharply with alum dosage to an asymptote. Figure and (2) at 6 pH 8, with dosage >2 10 M Al, aluminum
9.4b illustrates the effect of pH on color and EM from top to hydroxide precipitate occurs and removal is by adsorption
bottom, respectively, at the optimum dosage of 120 mg=L; (Edzwald et al., 1977, p. 990; Dempsey et al., 1984; Edwards
also that pH 4.5 is optimum. and Amirtharajah, 1985, p. 51).
9.3.2.3.2 Coagulation Zones for Color 9.3.2.3.3 Adsorption of NOM by Aluminum Hydroxide
Effective coagulation zones for fulvic acids (FA) were defined Regarding adsorption, the uptake of organic matter follows a
on p[Al] versus pH diagrams (Edwards and Amirtharajah, Langmuir isotherm (Chapter 15) such as shown in Figure 9.5
200 60
Color measured after filtering 50
jar test supernatant through
180
Color (Pt-Co units) 160 Color (Co-Pt units) 40
No. 615 filter paper
30
140
20
120
10
100 0
0.00 0.50
–0.10
–0.20 0.00
–0.30
Mobility (μm/s/V/cm) –0.50 Mobility (μm/s/V/cm) –0.50
–0.40
–0.60
–0.70
–0.80
–0.90
–1.00 Organic color= 270 cobalt units –1.00
Alkalinity=5 mg/L as CaCO
3
–1.10 Zeta-potential-13·EM
Alum dosage =120 mg/L as Al 2 (SO ) ·18H O
3 3
2
–1.20 –1.50
0 100 200 300 400 500 0 1 2 3 4 5 6 7 8 9 10
(a) Alum dose (mg Al (SO ) 18H O/L) (b) pH
4 3 *
2
2
FIGURE 9.4 Role of alum dosage and pH on EM and residual color (a) Effect of alum dosage (b) Effect of pH at constant alum dosage.
(From Black, A.P. and Willems, D.G., J. Am. Water Works Assoc., 53(5), 592, May 1961. With permission.)