
Page 246 - Fundamentals of Water Treatment Unit Processes : Physical, Chemical, and Biological
P. 246
Coagulation 201
+
+ + + + + + + + + +
+ + + + + + + + + + + + + + + + +
+ – – – – + + + + + – – – + + + + + + – – – – + + + + + +
–
+ – – – – – + + + + – – – – – + + + + + – – – – – +
– –
–
–
–
–
–
+ – – – – – – – + + – – – – – – + + + + + + + – – – – – + + + + +
–
– +
–
– –
+ – – – – – + + + – – – + – – +
–
– –
– +
–
–
+ – – – – + – + + + – – – – – – – – + + + + + + – – – – – + + +
+
– +
+ –– – –– + + – – – – – + + + + + – – – – +
+
+ + + + – + + + + + + + – + + + + + + +
+
(a) + + + (b) + (c) + + + +
Negative ion + Positive ion + + + Trivalent ion
Surface potential
Surface potential
Stern layer
Zeta potential
Surface potential
Stern layer Stern layer
Negative potential Diffuse layer Negative potential Zeta potential Negative potential Zeta potential
Plane of shear Plane of shear Diffuse layer Plane of shear Diffuse layer
(d) Distance from colloid surface (e) Distance from colloid surface (f) Distance from colloid surface
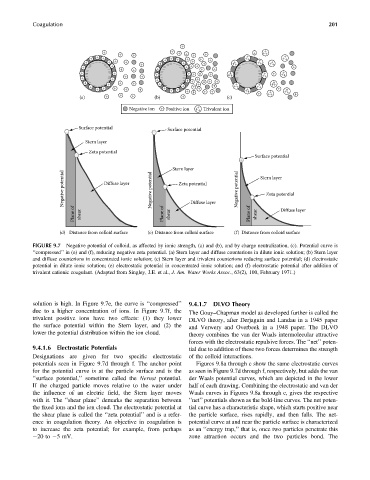
FIGURE 9.7 Negative potential of colloid, as affected by ionic strength, (a) and (b), and by charge neutralization, (c). Potential curve is
‘‘compressed’’ in (e) and (f), reducing negative zeta potential. (a) Stern layer and diffuse counterions in dilute ionic solution; (b) Stern layer
and diffuse counterions in concentrated ionic solution; (c) Stern layer and trivalent counterions reducing surface potential; (d) electrostatic
potential in dilute ionic solution; (e) electrostatic potential in concentrated ionic solution; and (f) electrostatic potential after addition of
trivalent cationic coagulant. (Adapted from Singley, J.E. et al., J. Am. Water Works Assoc., 63(2), 100, February 1971.)
solution is high. In Figure 9.7e, the curve is ‘‘compressed’’ 9.4.1.7 DLVO Theory
due to a higher concentration of ions. In Figure 9.7f, the The Gouy–Chapman model as developed further is called the
trivalent positive ions have two effects: (1) they lower DLVO theory, after Derjaguin and Landau in a 1945 paper
the surface potential within the Stern layer, and (2) the and Verwery and Overbeek in a 1948 paper. The DLVO
lower the potential distribution within the ion cloud. theory combines the van der Waals intermolecular attractive
forces with the electrostatic repulsive forces. The ‘‘net’’ poten-
9.4.1.6 Electrostatic Potentials tial due to addition of these two forces determines the strength
Designations are given for two specific electrostatic of the colloid interactions.
potentials seen in Figure 9.7d through f. The anchor point Figures 9.8a through c show the same electrostatic curves
for the potential curve is at the particle surface and is the as seen in Figure 9.7d through f, respectively, but adds the van
‘‘surface potential,’’ sometime called the Nernst potential. der Waals potential curves, which are depicted in the lower
If the charged particle moves relative to the water under half of each drawing. Combining the electrostatic and van der
the influence of an electric field, the Stern layer moves Waals curves in Figures 9.8a through c, gives the respective
with it. The ‘‘shear plane’’ demarks the separation between ‘‘net’’ potentials shown as the bold-line curves. The net poten-
the fixed ions and the ion cloud. The electrostatic potential at tial curve has a characteristic shape, which starts positive near
the shear plane is called the ‘‘zeta potential’’ and is a refer- the particle surface, rises rapidly, and then falls. The net-
ence in coagulation theory. An objective in coagulation is potential curve at and near the particle surface is characterized
to increase the zeta potential; for example, from perhaps as an ‘‘energy trap,’’ that is, once two particles penetrate this
20 to 5 mV. zone attraction occurs and the two particles bond. The