
Page 648 - Fundamentals of Water Treatment Unit Processes : Physical, Chemical, and Biological
P. 648
Gas Transfer 603
150 120
Air velocity:
3
2
Q΄/A=1.97 m /m /s) 100
100 80 3 2
K L a (h –1 ) K L a (h –1 ) 60 HLR = 0.0175 m /m /s
50 40
2
3
HLR= 0.00875 m /m /s
20
0 0
0 20 40 60 80 100 120 0 1 2 3 4 5
(a) HLR (m/h) (b) Q΄/A (m/s)
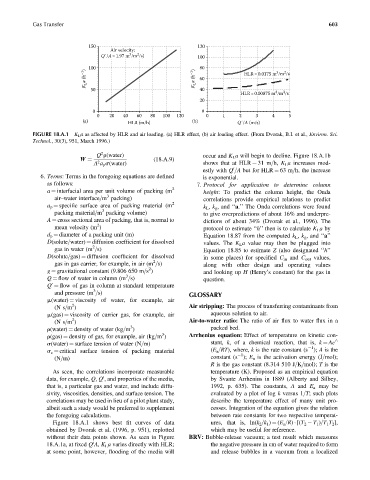
FIGURE 18.A.1 K L a as affected by HLR and air loading. (a) HLR effect, (b) air loading effect. (From Dvorak, B.I. et al., Environ. Sci.
Technol., 30(3), 951, March 1996.)
2
Q r(water) occur and K L a will begin to decline. Figure 18.A.1b
(18:A:9)
A a p s(water) shows that at HLR ¼ 31 m=h, K L a increases mod-
W ¼ 2
estly with Q =A but for HLR ¼ 63 m=h, the increase
0
6. Terms: Terms in the foregoing equations are defined is exponential.
as follows: 7. Protocol for application to determine column
a ¼ interfacial area per unit volume of packing (m 2 height: To predict the column height, the Onda
3
air–water interface=m packing) correlations provide empirical relations to predict
a p ¼ specific surface area of packing material (m 2 k L , k g , and ‘‘a.’’ The Onda correlations were found
3
packing material=m packing volume) to give overpredictions of about 16% and underpre-
A ¼ cross sectional area of packing, that is, normal to dictions of about 34% (Dvorak et al., 1996). The
2
mean velocity (m ) protocol to estimate ‘‘h’’ then is to calculate K L a by
d p ¼ diameter of a packing unit (m) Equation 18.87 from the computed k L , k g , and ‘‘a’’
D(solute=water) ¼ diffusion coefficient for dissolved values. The K L a value may then be plugged into
2
gas in water (m =s) Equation 18.85 to estimate Z (also designated ‘‘h’’
D(solute=gas) ¼ diffusion coefficient for dissolved in some places) for specified C in and C out values,
2
gas in gas carrier, for example, in air (m =s) along with other design and operating values
2
g ¼ gravitational constant (9.806 650 m=s ) and looking up H (Henry’s constant) for the gas in
3
Q ¼ flow of water in column (m =s) question.
Q ¼ flow of gas in column at standard temperature
0
3
and pressure (m =s) GLOSSARY
m(water) ¼ viscosity of water, for example, air
2
(N s=m ) Air stripping: The process of transferring contaminants from
m(gas) ¼ viscosity of carrier gas, for example, air aqueous solution to air.
2
(N s=m ) Air-to-water ratio: The ratio of air flux to water flux in a
3
r(water) ¼ density of water (kg=m ) packed bed.
3
r(gas) ¼ density of gas, for example, air (kg=m ) Arrhenius equation: Effect of temperature on kinetic con-
s(water) ¼ surface tension of water (N=m) stant, k, of a chemical reaction, that is, k ¼ Ae ^
1
s c ¼ critical surface tension of packing material (E a =RT), where, k is the rate constant (s ); A is the
1
(N=m) constant (s ); E a is the activation energy (J=mol);
R is the gas constant (8.314 510 J=K=mol); T is the
As seen, the correlations incorporate measurable temperature (K). Proposed as an empirical equation
data, for example, Q, Q , and properties of the media, by Svante Arrhenius in 1889 (Alberty and Silbey,
0
that is, a particular gas and water, and include diffu- 1992, p. 635). The constants, A and E a may be
sivity, viscosities, densities, and surface tension. The evaluated by a plot of log k versus 1=T; such plots
correlations may be used in lieu of a pilot plant study, describe the temperature effect of many unit pro-
albeit such a study would be preferred to supplement cesses. Integration of the equation gives the relation
the foregoing calculations. between rate constants for two respective temperat-
Figure 18.A.1 shows best fit curves of data ures, that is, ln(k 2 =k 1 ) ¼ (E a =R) [(T 2 T 1 )=T 1 T 2 ],
obtained by Dvorak et al. (1996, p. 951), replotted which may be useful for reference.
without their data points shown. As seen in Figure BRV: Bubble-release vacuum; a test result which measures
18.A.1a, at fixed Q A, K L a varies directly with HLR; the negative pressure in cm of water required to form
0
at some point, however, flooding of the media will and release bubbles in a vacuum from a localized