Page 646 - Fundamentals of Water Treatment Unit Processes : Physical, Chemical, and Biological
P. 646
Gas Transfer                                                                                     601


                  Determine also the K L a coefficient and compare with  Given
                  values given from aeration installations.          . Bubble aeration
                                                                                          1
                                                                     . K L a(measured) ¼ 2.5 h .
                 Hint: Obtain properties from Appendices and calculate
                                                                     . h(diffuser) 1 ¼ 5.0 m (16.4 ft)
                 diffusivities by the Wilke–Chang equation.
            18.13 Aerator Test Data                                  Required
                  Given                                              Estimate the effects of changing one variable at a time
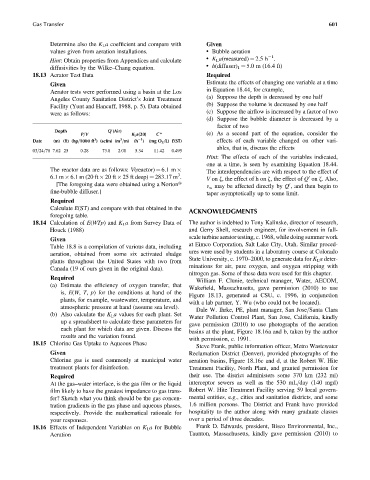
                  Aerator tests were performed using a basin at the Los  in Equation 18.44, for example,
                  Angeles County Sanitation District’s Joint Treatment  (a) Suppose the depth is decreased by one half
                  Facility (Yunt and Hancuff, 1988, p. 5). Data obtained  (b) Suppose the volume is decreased by one half
                                                                     (c) Suppose the airflow is increased by a factor of two
                  were as follows:
                                                                     (d) Suppose the bubble diameter is decreased by a
                                                                        factor of two
                   Depth            Q (Air)
                                      0
                            P=V             K L a(20)  C *           (e) As a second part of the equation, consider the
                                3
                                               1
                                         3
            Date   (m) (ft) (hp=1000 ft ) (scfm) (m =m)  (h )  (mg O 2 =L) E(ST)  effects of each variable changed on other vari-
                                                                        ables, that is, discuss the effects
            03=24=78 7.62 25  0.28  73.8  2.08  5.34  11.42  0.495
                                                                     Hint: The effects of each of the variables indicated,
                                                                     one at a time, is seen by examining Equation 18.44.
                  The reactor data are as follows: V(reactor) ¼ 6.1 m    The interdependencies are with respect to the effect of
                                                            3
                  6.1 m   6.1 m (20 ft   20 ft   25 ft deep) ¼ 283.17 m .  V on z, the effect of h on z, the effect of Q on z. Also,
                                                                                                       0
                    [The foregoing data were obtained using a Nortont  v w may be affected directly by Q , and then begin to
                                                                                                0
                  fine-bubble diffuser.]                              taper asymptotically up to some limit.
                  Required
                  Calculate E(ST) and compare with that obtained in the  ACKNOWLEDGMENTS
                  foregoing table.
            18.14 Calculation of E(WTp) and K L a from Survey Data of  The author is indebted to Tony Kalinske, director of research,
                 Houck (1988)                                  and Gerry Shell, research engineer, for involvement in full-
                                                               scale turbine aerator testing, c. 1968, while doing summer work
                  Given
                                                               at Eimco Corporation, Salt Lake City, Utah. Similar proced-
                  Table 18.8 is a compilation of various data, including
                                                               ures were used by students in a laboratory course at Colorado
                  aeration, obtained from some six activated sludge
                                                               State University, c. 1970–2000, to generate data for K L a deter-
                  plants throughout the United States with two from
                                                               minations for air, pure oxygen, and oxygen stripping with
                  Canada (19 of ours given in the original data).
                                                               nitrogen gas. Some of these data were used for this chapter.
                  Required
                                                                  William F. Clunie, technical manager, Water, AECOM,
                  (a) Estimate the efficiency of oxygen transfer, that
                                                               Wakefield, Massachusetts, gave permission (2010) to use
                     is, E(W, T, p) for the conditions at hand of the
                                                               Figure 18.13, generated at CSU, c. 1996, in conjunction
                     plants, for example, wastewater, temperature, and
                                                               with a lab partner, Y. Wu (who could not be located).
                     atmospheric pressure at hand (assume sea level).
                                                                  Dale W. Ihrke, PE, plant manager, San Jose=Santa Clara
                  (b) Also calculate the K L a values for each plant. Set
                                                               Water Pollution Control Plant, San Jose, California, kindly
                     up a spreadsheet to calculate these parameters for
                                                               gave permission (2010) to use photographs of the aeration
                     each plant for which data are given. Discuss the
                                                               basins at the plant, Figure 18.16a and b, taken by the author
                     results and the variation found.
                                                               with permission, c. 1991.
            18.15 Chlorine Gas Uptake to Aqueous Phase
                                                                  Steve Frank, public information officer, Metro Wastewater
                  Given                                        Reclamation District (Denver), provided photographs of the
                  Chlorine gas is used commonly at municipal water  aeration basins, Figure 18.16c and d, at the Robert W. Hite
                  treatment plants for disinfection.           Treatment Facility, North Plant, and granted permission for
                  Required                                     their use. The district administers some 370 km (232 mi)
                  At the gas–water interface, is the gas film or the liquid  interceptor sewers as well as the 530 mL=day (140 mgd)
                  film likely to have the greatest impedance to gas trans-  Robert W. Hite Treatment Facility serving 59 local govern-
                  fer? Sketch what you think should be the gas concen-  mental entities, e.g., cities and sanitation districts, and some
                  tration gradients in the gas phase and aqueous phases,  1.6 million persons. The District and Frank have provided
                  respectively. Provide the mathematical rationale for  hospitality to the author along with many graduate classes
                  your responses.                              over a period of three decades.
            18.16 Effects of Independent Variables on K L a for Bubble  Frank D. Edwards, president, Bisco Environmental, Inc.,
                 Aeration                                      Taunton, Massachusetts, kindly gave permission (2010) to

