
Page 169 - Gas Adsorption Equilibria
P. 169
3. Gravimetry 155
In Figure 3.23 the basic flow diagram of an instrument for thermo-
gravimetric measurements with an automated gas dosing system and pressure
control device is sketched. Application oriented details and hints for the
measurement procedure are given in [3.5, 3.6].
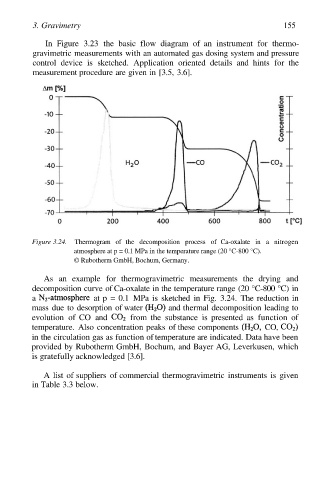
Figure 3.24. Thermogram of the decomposition process of Ca-oxalate in a nitrogen
atmosphere at p = 0.1 MPa in the temperature range (20 °C-800 °C).
© Rubotherm GmbH, Bochum, Germany.
As an example for thermogravimetric measurements the drying and
decomposition curve of Ca-oxalate in the temperature range (20 °C-800 °C) in
a at p = 0.1 MPa is sketched in Fig. 3.24. The reduction in
mass due to desorption of water and thermal decomposition leading to
evolution of CO and from the substance is presented as function of
temperature. Also concentration peaks of these components CO,
in the circulation gas as function of temperature are indicated. Data have been
provided by Rubotherm GmbH, Bochum, and Bayer AG, Leverkusen, which
is gratefully acknowledged [3.6].
A list of suppliers of commercial thermogravimetric instruments is given
in Table 3.3 below.