
Page 278 - gas transport in porous media
P. 278
Chapter 15: Air Permeability Measurements in Porous Media
P o P 1 P o 275
Q=0 Q=0
Figure 15.1. Tip seal compressed on porous medium. Shown are the boundary conditions and schematic
of flow lines.
(a) 30 (b)
25
25
20
20
ZAxis (cm) 15 ZAxis (cm) 15
10
10
5
5
0
0
0 5 10 15 20 25
0 5 10 15 20 25 30
X Axis (cm) X Axis (cm)
–29.0 –28.0 –27.0 –26.0 –25.0
ln(k)
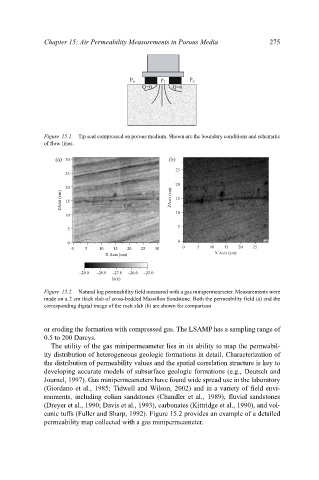
Figure 15.2. Natural log permeability field measured with a gas minipermeameter. Measurements were
made ona2cm thick slab of cross-bedded Massillon Sandstone. Both the permeability field (a) and the
corresponding digital image of the rock slab (b) are shown for comparison
or eroding the formation with compressed gas. The LSAMP has a sampling range of
0.5 to 200 Darcys.
The utility of the gas minipermeameter lies in its ability to map the permeabil-
ity distribution of heterogeneous geologic formations in detail. Characterization of
the distribution of permeability values and the spatial correlation structure is key to
developing accurate models of subsurface geologic formations (e.g., Deutsch and
Journel, 1997). Gas minipermeameters have found wide spread use in the laboratory
(Giordano et al., 1985; Tidwell and Wilson, 2002) and in a variety of field envi-
ronments, including eolian sandstones (Chandler et al., 1989), fluvial sandstones
(Dreyer et al., 1990; Davis et al., 1993), carbonates (Kittridge et al., 1990), and vol-
canic tuffs (Fuller and Sharp, 1992). Figure 15.2 provides an example of a detailed
permeability map collected with a gas minipermeameter.