
Page 329 - gas transport in porous media
P. 329
328
In Situ Flux Measurement
Sampling location "1"; 6 feet deep Tartre
30
1400
Concentrations
25 [gas in %] 1200
20 1000
800
15 Concentrations [vapors in ppm]
600
10
400
5
200
0 0
3 2 1 0 1
Time (in minutes)
Oxygen Vapors
In Situ Flux Measurement
Sampling location "13"; 6 feet deep
25
1400
20 1200
Concentrations 1000
[gas in %]
15
800 Concentrations [vapors in ppm]
10 600
400
5
200
0 0
5 4 3 2 1 0 1 2 3
Time (in minutes)
Oxygen Vapors
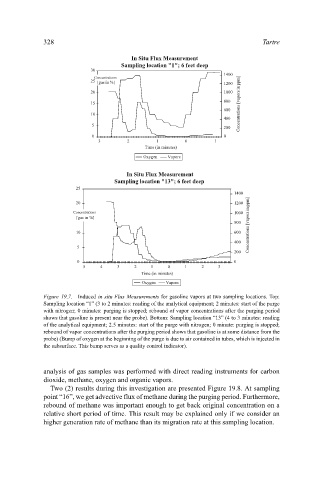
Figure 19.7. Induced in situ Flux Measurements for gasoline vapors at two sampling locations. Top:
Sampling location “1” (3 to 2 minutes: reading of the analytical equipment; 2 minutes: start of the purge
with nitrogen; 0 minutes: purging is stopped; rebound of vapor concentrations after the purging period
shows that gasoline is present near the probe). Bottom: Sampling location “13” (4 to 3 minutes: reading
of the analytical equipment; 2.5 minutes: start of the purge with nitrogen; 0 minute: purging is stopped;
rebound of vapor concentrations after the purging period shows that gasoline is at some distance from the
probe) (Bump of oxygen at the beginning of the purge is due to air contained in tubes, which is injected in
the subsurface. This bump serves as a quality control indicator).
analysis of gas samples was performed with direct reading instruments for carbon
dioxide, methane, oxygen and organic vapors.
Two (2) results during this investigation are presented Figure 19.8. At sampling
point “16”, we get advective flux of methane during the purging period. Furthermore,
rebound of methane was important enough to get back original concentration on a
relative short period of time. This result may be explained only if we consider an
higher generation rate of methane than its migration rate at this sampling location.