
Page 190 - Geochemical Anomaly and Mineral Prospectivity Mapping in GIS
P. 190
192 Chapter 7
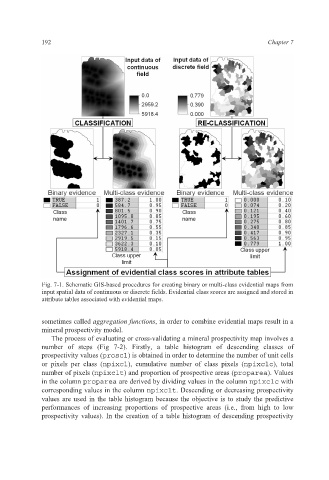
Fig. 7-1. Schematic GIS-based procedures for creating binary or multi-class evidential maps from
input spatial data of continuous or discrete fields. Evidential class scores are assigned and stored in
attribute tables associated with evidential maps.
sometimes called aggregation functions, in order to combine evidential maps result in a
mineral prospectivity model.
The process of evaluating or cross-validating a mineral prospectivity map involves a
number of steps (Fig 7-2). Firstly, a table histogram of descending classes of
prospectivity values (proscl) is obtained in order to determine the number of unit cells
or pixels per class (npixcl), cumulative number of class pixels (npixclc), total
number of pixels (npixclt) and proportion of prospective areas (proparea). Values
in the column proparea are derived by dividing values in the column npixclc with
corresponding values in the column npixclt. Descending or decreasing prospectivity
values are used in the table histogram because the objective is to study the predictive
performances of increasing proportions of prospective areas (i.e., from high to low
prospectivity values). In the creation of a table histogram of descending prospectivity