
Page 195 - Geochemical Anomaly and Mineral Prospectivity Mapping in GIS
P. 195
Knowledge-Driven Modeling of Mineral Prospectivity 197
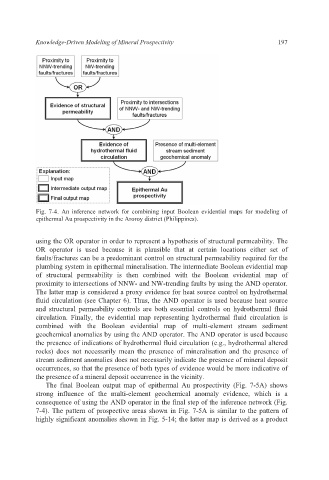
Fig. 7-4. An inference network for combining input Boolean evidential maps for modeling of
epithermal Au prospectivity in the Aroroy district (Philippines).
using the OR operator in order to represent a hypothesis of structural permeability. The
OR operator is used because it is plausible that at certain locations either set of
faults/fractures can be a predominant control on structural permeability required for the
plumbing system in epithermal mineralisation. The intermediate Boolean evidential map
of structural permeability is then combined with the Boolean evidential map of
proximity to intersections of NNW- and NW-trending faults by using the AND operator.
The latter map is considered a proxy evidence for heat source control on hydrothermal
fluid circulation (see Chapter 6). Thus, the AND operator is used because heat source
and structural permeability controls are both essential controls on hydrothermal fluid
circulation. Finally, the evidential map representing hydrothermal fluid circulation is
combined with the Boolean evidential map of multi-element stream sediment
geochemical anomalies by using the AND operator. The AND operator is used because
the presence of indications of hydrothermal fluid circulation (e.g., hydrothermal altered
rocks) does not necessarily mean the presence of mineralisation and the presence of
stream sediment anomalies does not necessarily indicate the presence of mineral deposit
occurrences, so that the presence of both types of evidence would be more indicative of
the presence of a mineral deposit occurrence in the vicinity.
The final Boolean output map of epithermal Au prospectivity (Fig. 7-5A) shows
strong influence of the multi-element geochemical anomaly evidence, which is a
consequence of using the AND operator in the final step of the inference network (Fig.
7-4). The pattern of prospective areas shown in Fig. 7-5A is similar to the pattern of
highly significant anomalies shown in Fig. 5-14; the latter map is derived as a product