
Page 200 - Geochemical Anomaly and Mineral Prospectivity Mapping in GIS
P. 200
202 Chapter 7
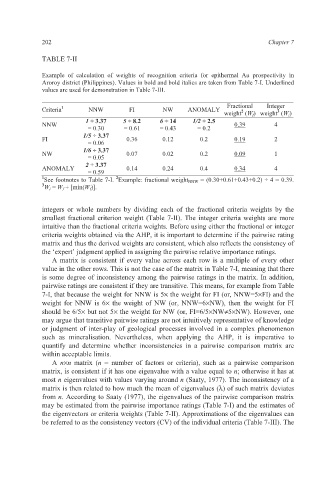
TABLE 7-II
Example of calculation of weights of recognition criteria for epithermal Au prospectivity in
Aroroy district (Philippines). Values in bold and bold italics are taken from Table 7-I. Underlined
values are used for demonstration in Table 7-III.
Criteria 1 NNW FI NW ANOMALY Fractional Integer
3
2
weight (W f ) weight (W i )
1 ÷ 3.37 5 ÷ 8.2 6 ÷ 14 1/2 ÷ 2.5
NNW 0.39 4
= 0.30 = 0.61 = 0.43 = 0.2
1/5 ÷ 3.37
FI 0.36 0.12 0.2 0.19 2
= 0.06
1/6 ÷ 3.37
NW 0.07 0.02 0.2 0.09 1
= 0.05
2 ÷ 3.37
ANOMALY 0.14 0.24 0.4 0.34 4
= 0.59
1 See footnotes to Table 7-I. Example: fractional weight NNW = (0.30+0.61+0.43+0.2) ÷ 4 = 0.39.
2
3 W i = W f ÷ [min(W f )].
integers or whole numbers by dividing each of the fractional criteria weights by the
smallest fractional criterion weight (Table 7-II). The integer criteria weights are more
intuitive than the fractional criteria weights. Before using either the fractional or integer
criteria weights obtained via the AHP, it is important to determine if the pairwise rating
matrix and thus the derived weights are consistent, which also reflects the consistency of
the ‘expert’ judgment applied in assigning the pairwise relative importance ratings.
A matrix is consistent if every value across each row is a multiple of every other
value in the other rows. This is not the case of the matrix in Table 7-I, meaning that there
is some degree of inconsistency among the pairwise ratings in the matrix. In addition,
pairwise ratings are consistent if they are transitive. This means, for example from Table
7-I, that because the weight for NNW is 5× the weight for FI (or, NNW=5×FI) and the
weight for NNW is 6× the weight of NW (or, NNW=6×NW), then the weight for FI
should be 6/5× but not 5× the weight for NW (or, FI=6/5×NW≠5×NW). However, one
may argue that transitive pairwise ratings are not intuitively representative of knowledge
or judgment of inter-play of geological processes involved in a complex phenomenon
such as mineralisation. Nevertheless, when applying the AHP, it is imperative to
quantify and determine whether inconsistencies in a pairwise comparison matrix are
within acceptable limits.
A n×n matrix (n = number of factors or criteria), such as a pairwise comparison
matrix, is consistent if it has one eigenvalue with a value equal to n; otherwise it has at
most n eigenvalues with values varying around n (Saaty, 1977). The inconsistency of a
matrix is then related to how much the mean of eigenvalues (λ) of such matrix deviates
from n. According to Saaty (1977), the eigenvalues of the pairwise comparison matrix
may be estimated from the pairwise importance ratings (Table 7-I) and the estimates of
the eigenvectors or criteria weights (Table 7-II). Approximations of the eigenvalues can
be referred to as the consistency vectors (CV) of the individual criteria (Table 7-III). The