
Page 204 - Geochemical Anomaly and Mineral Prospectivity Mapping in GIS
P. 204
206 Chapter 7
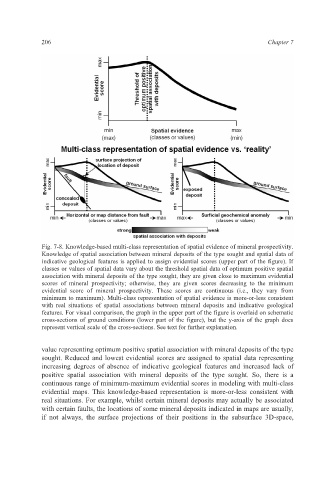
Fig. 7-8. Knowledge-based multi-class representation of spatial evidence of mineral prospectivity.
Knowledge of spatial association between mineral deposits of the type sought and spatial data of
indicative geological features is applied to assign evidential scores (upper part of the figure). If
classes or values of spatial data vary about the threshold spatial data of optimum positive spatial
association with mineral deposits of the type sought, they are given close to maximum evidential
scores of mineral prospectivity; otherwise, they are given scores decreasing to the minimum
evidential score of mineral prospectivity. These scores are continuous (i.e., they vary from
minimum to maximum). Multi-class representation of spatial evidence is more-or-less consistent
with real situations of spatial associations between mineral deposits and indicative geological
features. For visual comparison, the graph in the upper part of the figure is overlaid on schematic
cross-sections of ground conditions (lower part of the figure), but the y-axis of the graph does
represent vertical scale of the cross-sections. See text for further explanation.
value representing optimum positive spatial association with mineral deposits of the type
sought. Reduced and lowest evidential scores are assigned to spatial data representing
increasing degrees of absence of indicative geological features and increased lack of
positive spatial association with mineral deposits of the type sought. So, there is a
continuous range of minimum-maximum evidential scores in modeling with multi-class
evidential maps. This knowledge-based representation is more-or-less consistent with
real situations. For example, whilst certain mineral deposits may actually be associated
with certain faults, the locations of some mineral deposits indicated in maps are usually,
if not always, the surface projections of their positions in the subsurface 3D-space,