
Page 206 - Geochemical Anomaly and Mineral Prospectivity Mapping in GIS
P. 206
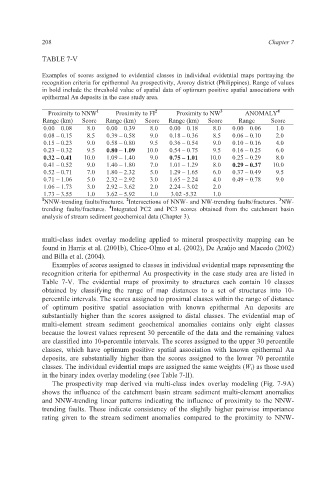
208                                                             Chapter 7

             TABLE 7-V

             Examples of scores assigned to evidential classes in individual evidential maps portraying the
             recognition criteria for epithermal Au prospectivity, Aroroy district (Philippines). Range of values
             in bold include the threshold value of spatial data of optimum positive spatial associations with
             epithermal Au deposits in the case study area.

                                                                                4
               Proximity to NNW 1  Proximity  to FI 2  Proximity  to  NW 3  ANOMALY
             Range (km)   Score   Range (km)  Score   Range (km)  Score   Range   Score
             0.00 – 0.08   8.0   0.00 – 0.39  8.0   0.00 – 0.18  8.0   0.00 – 0.06   1.0
             0.08 – 0.15   8.5   0.39 – 0.58  9.0   0.18 – 0.36  8.5   0.06 – 0.10   2.0
             0.15 – 0.23   9.0   0.58 – 0.80  9.5   0.36 – 0.54  9.0   0.10 – 0.16   4.0
             0.23 – 0.32   9.5   0.80 – 1.09  10.0   0.54 – 0.75  9.5   0.16 – 0.25   6.0
             0.32 – 0.41   10.0   1.09 – 1.40  9.0   0.75 – 1.01  10.0   0.25 – 0.29   8.0
             0.41 – 0.52   9.0   1.40 – 1.80  7.0   1.01 – 1.29  8.0   0.29 – 0.37   10.0
             0.52 – 0.71   7.0   1.80 – 2.32  5.0   1.29 – 1.65  6.0   0.37 – 0.49   9.5
             0.71 – 1.06   5.0   2.32 – 2.92  3.0   1.65 – 2.24  4.0   0.49 – 0.78   9.0
             1.06 – 1.73   3.0   2.92 – 3.62  2.0   2.24 – 3.02  2.0
             1.73 – 3.55   1.0   3.62 – 5.92  1.0   3.02 -5.32  1.0
                                     2
                                                                                3
             1 NNW-trending faults/fractures.  Intersections of NNW- and NW-trending faults/fractures.  NW-
                                4
             trending faults/fractures.  Integrated PC2 and  PC3 scores obtained from the catchment basin
             analysis of stream sediment geochemical data (Chapter 3).
             multi-class index overlay modeling applied to  mineral prospectivity  mapping can be
             found in Harris et al. (2001b), Chico-Olmo et al. (2002), De Araújo and Macedo (2002)
             and Billa et al. (2004).
                Examples of scores assigned to classes in individual evidential maps representing the
             recognition criteria for epithermal Au prospectivity in the case study area are listed in
             Table 7-V. The evidential maps of proximity  to structures each contain 10 classes
             obtained by classifying the range  of map distances to a set of structures into  10-
             percentile intervals. The scores assigned to proximal classes within the range of distance
             of optimum  positive spatial association with known epithermal  Au  deposits are
             substantially higher than the scores assigned to distal classes. The evidential map of
             multi-element stream sediment geochemical anomalies contains  only eight classes
             because the lowest values represent 30 percentile of the data and the remaining values
             are classified into 10-percentile intervals. The scores assigned to the upper 30 percentile
             classes,  which have  optimum positive spatial association  with  known epithermal Au
             deposits, are substantially higher than the  scores assigned to the lower 70  percentile
             classes. The individual evidential maps are assigned the same weights (W i) as those used
             in the binary index overlay modeling (see Table 7-II).
                The prospectivity map derived via multi-class index overlay modeling (Fig. 7-9A)
             shows the influence of the catchment basin stream sediment  multi-element anomalies
             and NNW-trending linear patterns indicating the influence of proximity to the NNW-
             trending faults. These indicate consistency of the slightly higher pairwise importance
             rating  given to the stream sediment anomalies compared to the  proximity to NNW-