
Page 202 - Geochemical Anomaly and Mineral Prospectivity Mapping in GIS
P. 202
204 Chapter 7
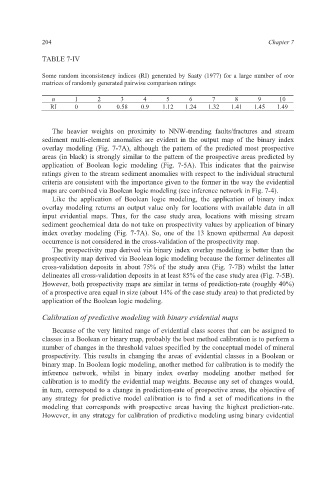
TABLE 7-IV
Some random inconsistency indices (RI) generated by Saaty (1977) for a large number of n×n
matrices of randomly generated pairwise comparison ratings
n 1 2 3 4 5 6 7 8 9 10
RI 0 0 0.58 0.9 1.12 1.24 1.32 1.41 1.45 1.49
The heavier weights on proximity to NNW-trending faults/fractures and stream
sediment multi-element anomalies are evident in the output map of the binary index
overlay modeling (Fig. 7-7A), although the pattern of the predicted most prospective
areas (in black) is strongly similar to the pattern of the prospective areas predicted by
application of Boolean logic modeling (Fig. 7-5A). This indicates that the pairwise
ratings given to the stream sediment anomalies with respect to the individual structural
criteria are consistent with the importance given to the former in the way the evidential
maps are combined via Boolean logic modeling (see inference network in Fig. 7-4).
Like the application of Boolean logic modeling, the application of binary index
overlay modeling returns an output value only for locations with available data in all
input evidential maps. Thus, for the case study area, locations with missing stream
sediment geochemical data do not take on prospectivity values by application of binary
index overlay modeling (Fig. 7-7A). So, one of the 13 known epithermal Au deposit
occurrence is not considered in the cross-validation of the prospectivity map.
The prospectivity map derived via binary index overlay modeling is better than the
prospectivity map derived via Boolean logic modeling because the former delineates all
cross-validation deposits in about 75% of the study area (Fig. 7-7B) whilst the latter
delineates all cross-validation deposits in at least 85% of the case study area (Fig. 7-5B).
However, both prospectivity maps are similar in terms of prediction-rate (roughly 40%)
of a prospective area equal in size (about 14% of the case study area) to that predicted by
application of the Boolean logic modeling.
Calibration of predictive modeling with binary evidential maps
Because of the very limited range of evidential class scores that can be assigned to
classes in a Boolean or binary map, probably the best method calibration is to perform a
number of changes in the threshold values specified by the conceptual model of mineral
prospectivity. This results in changing the areas of evidential classes in a Boolean or
binary map. In Boolean logic modeling, another method for calibration is to modify the
inference network, whilst in binary index overlay modeling another method for
calibration is to modify the evidential map weights. Because any set of changes would,
in turn, correspond to a change in prediction-rate of prospective areas, the objective of
any strategy for predictive model calibration is to find a set of modifications in the
modeling that corresponds with prospective areas having the highest prediction-rate.
However, in any strategy for calibration of predictive modeling using binary evidential