
Page 201 - Geochemical Anomaly and Mineral Prospectivity Mapping in GIS
P. 201
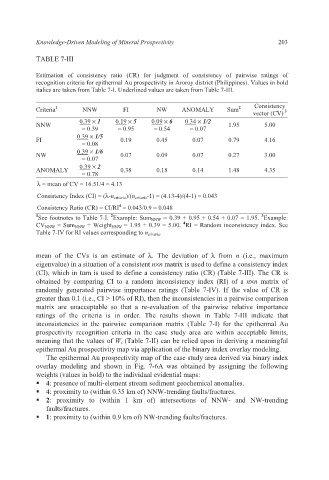
Knowledge-Driven Modeling of Mineral Prospectivity 203
TABLE 7-III
Estimation of consistency ratio (CR) for judgment of consistency of pairwise ratings of
recognition criteria for epithermal Au prospectivity in Aroroy district (Philippines). Values in bold
italics are taken from Table 7-I. Underlined values are taken from Table 7-III.
2
Criteria 1 NNW FI NW ANOMALY Sum Consistency
3
vector (CV)
0.39 × 1 0.19 × 5 0.09 × 6 0.34 × 1/2
NNW 1.95 5.00
= 0.39 = 0.95 = 0.54 = 0.07
0.39 × 1/5
FI 0.19 0.45 0.07 0.79 4.16
= 0.08
0.39 × 1/6
NW 0.07 0.09 0.07 0.27 3.00
= 0.07
0.39 × 2
ANOMALY 0.38 0.18 0.14 1.48 4.35
= 0.78
λ = mean of CV = 16.51/4 = 4.13
Consistency Index (CI) = (λ-n criteria )/(n criteria -1) = (4.13-4)/(4-1) = 0.043
4
Consistency Ratio (CR) = CI/RI = 0.043/0.9 = 0.048
1 See footnotes to Table 7-I. Example: Sum NNW = 0.39 + 0.95 + 0.54 + 0.07 = 1.95. Example:
2
3
4
CV NNW = Sum NNW ÷ Weight NNW = 1.95 ÷ 0.39 = 5.00. RI = Random inconsistency index. See
Table 7-IV for RI values corresponding to n criteria .
mean of the CVs is an estimate of λ. The deviation of λ from n (i.e., maximum
eigenvalue) in a situation of a consistent n×n matrix is used to define a consistency index
(CI), which in turn is used to define a consistency ratio (CR) (Table 7-III). The CR is
obtained by comparing CI to a random inconsistency index (RI) of a n×n matrix of
randomly generated pairwise importance ratings (Table 7-IV). If the value of CR is
greater than 0.1 (i.e., CI > 10% of RI), then the inconsistencies in a pairwise comparison
matrix are unacceptable so that a re-evaluation of the pairwise relative importance
ratings of the criteria is in order. The results shown in Table 7-III indicate that
inconsistencies in the pairwise comparison matrix (Table 7-I) for the epithermal Au
prospectivity recognition criteria in the case study area are within acceptable limits,
meaning that the values of W i (Table 7-II) can be relied upon in deriving a meaningful
epithermal Au prospectivity map via application of the binary index overlay modeling.
The epithermal Au prospectivity map of the case study area derived via binary index
overlay modeling and shown in Fig. 7-6A was obtained by assigning the following
weights (values in bold) to the individual evidential maps:
4: presence of multi-element stream sediment geochemical anomalies.
4: proximity to (within 0.35 km of) NNW-trending faults/fractures.
2: proximity to (within 1 km of) intersections of NNW- and NW-trending
faults/fractures.
1: proximity to (within 0.9 km of) NW-trending faults/fractures.