
Page 203 - Geochemical Anomaly and Mineral Prospectivity Mapping in GIS
P. 203
Knowledge-Driven Modeling of Mineral Prospectivity 205
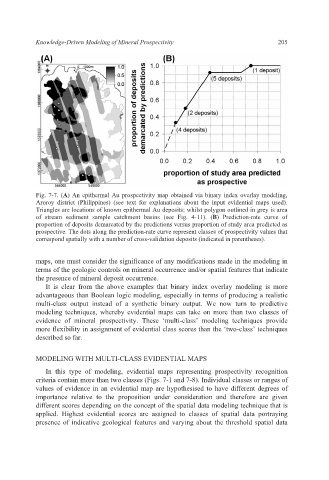
Fig. 7-7. (A) An epithermal Au prospectivity map obtained via binary index overlay modeling,
Aroroy district (Philippines) (see text for explanations about the input evidential maps used).
Triangles are locations of known epithermal Au deposits; whilst polygon outlined in grey is area
of stream sediment sample catchment basins (see Fig. 4-11). (B) Prediction-rate curve of
proportion of deposits demarcated by the predictions versus proportion of study area predicted as
prospective. The dots along the prediction-rate curve represent classes of prospectivity values that
correspond spatially with a number of cross-validation deposits (indicated in parentheses).
maps, one must consider the significance of any modifications made in the modeling in
terms of the geologic controls on mineral occurrence and/or spatial features that indicate
the presence of mineral deposit occurrence.
It is clear from the above examples that binary index overlay modeling is more
advantageous than Boolean logic modeling, especially in terms of producing a realistic
multi-class output instead of a synthetic binary output. We now turn to predictive
modeling techniques, whereby evidential maps can take on more than two classes of
evidence of mineral prospectivity. These ‘multi-class’ modeling techniques provide
more flexibility in assignment of evidential class scores than the ‘two-class’ techniques
described so far.
MODELING WITH MULTI-CLASS EVIDENTIAL MAPS
In this type of modeling, evidential maps representing prospectivity recognition
criteria contain more than two classes (Figs. 7-1 and 7-8). Individual classes or ranges of
values of evidence in an evidential map are hypothesised to have different degrees of
importance relative to the proposition under consideration and therefore are given
different scores depending on the concept of the spatial data modeling technique that is
applied. Highest evidential scores are assigned to classes of spatial data portraying
presence of indicative geological features and varying about the threshold spatial data