
Page 207 - Geochemical Anomaly and Mineral Prospectivity Mapping in GIS
P. 207
Knowledge-Driven Modeling of Mineral Prospectivity 209
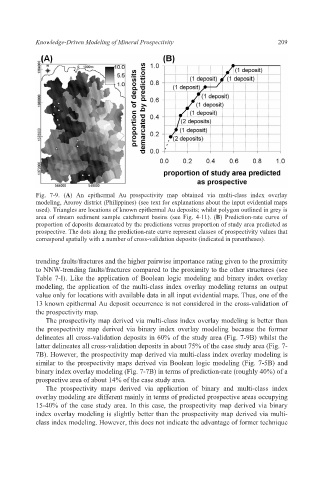
Fig. 7-9. (A) An epithermal Au prospectivity map obtained via multi-class index overlay
modeling, Aroroy district (Philippines) (see text for explanations about the input evidential maps
used). Triangles are locations of known epithermal Au deposits; whilst polygon outlined in grey is
area of stream sediment sample catchment basins (see Fig. 4-11). (B) Prediction-rate curve of
proportion of deposits demarcated by the predictions versus proportion of study area predicted as
prospective. The dots along the prediction-rate curve represent classes of prospectivity values that
correspond spatially with a number of cross-validation deposits (indicated in parentheses).
trending faults/fractures and the higher pairwise importance rating given to the proximity
to NNW-trending faults/fractures compared to the proximity to the other structures (see
Table 7-I). Like the application of Boolean logic modeling and binary index overlay
modeling, the application of the multi-class index overlay modeling returns an output
value only for locations with available data in all input evidential maps. Thus, one of the
13 known epithermal Au deposit occurrence is not considered in the cross-validation of
the prospectivity map.
The prospectivity map derived via multi-class index overlay modeling is better than
the prospectivity map derived via binary index overlay modeling because the former
delineates all cross-validation deposits in 60% of the study area (Fig. 7-9B) whilst the
latter delineates all cross-validation deposits in about 75% of the case study area (Fig. 7-
7B). However, the prospectivity map derived via multi-class index overlay modeling is
similar to the prospectivity maps derived via Boolean logic modeling (Fig. 7-5B) and
binary index overlay modeling (Fig. 7-7B) in terms of prediction-rate (roughly 40%) of a
prospective area of about 14% of the case study area.
The prospectivity maps derived via application of binary and multi-class index
overlay modeling are different mainly in terms of predicted prospective areas occupying
15-40% of the case study area. In this case, the prospectivity map derived via binary
index overlay modeling is slightly better than the prospectivity map derived via multi-
class index modeling. However, this does not indicate the advantage of former technique