
Page 196 - Geochemical Anomaly and Mineral Prospectivity Mapping in GIS
P. 196
198 Chapter 7
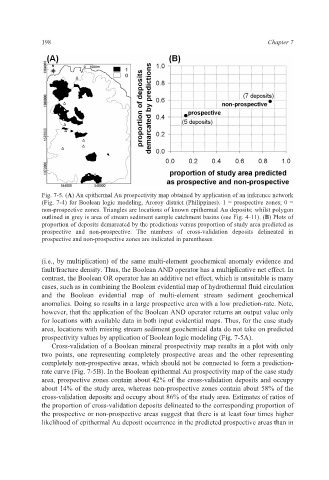
Fig. 7-5. (A) An epithermal Au prospectivity map obtained by application of an inference network
(Fig. 7-4) for Boolean logic modeling, Aroroy district (Philippines). 1 = prospective zones; 0 =
non-prospective zones. Triangles are locations of known epithermal Au deposits; whilst polygon
outlined in grey is area of stream sediment sample catchment basins (see Fig. 4-11). (B) Plots of
proportion of deposits demarcated by the predictions versus proportion of study area predicted as
prospective and non-prospective. The numbers of cross-validation deposits delineated in
prospective and non-prospective zones are indicated in parentheses.
(i.e., by multiplication) of the same multi-element geochemical anomaly evidence and
fault/fracture density. Thus, the Boolean AND operator has a multiplicative net effect. In
contrast, the Boolean OR operator has an additive net effect, which is unsuitable is many
cases, such as in combining the Boolean evidential map of hydrothermal fluid circulation
and the Boolean evidential map of multi-element stream sediment geochemical
anomalies. Doing so results in a large prospective area with a low prediction-rate. Note,
however, that the application of the Boolean AND operator returns an output value only
for locations with available data in both input evidential maps. Thus, for the case study
area, locations with missing stream sediment geochemical data do not take on predicted
prospectivity values by application of Boolean logic modeling (Fig. 7-5A).
Cross-validation of a Boolean mineral prospectivity map results in a plot with only
two points, one representing completely prospective areas and the other representing
completely non-prospective areas, which should not be connected to form a prediction-
rate curve (Fig. 7-5B). In the Boolean epithermal Au prospectivity map of the case study
area, prospective zones contain about 42% of the cross-validation deposits and occupy
about 14% of the study area, whereas non-prospective zones contain about 58% of the
cross-validation deposits and occupy about 86% of the study area. Estimates of ratios of
the proportion of cross-validation deposits delineated to the corresponding proportion of
the prospective or non-prospective areas suggest that there is at least four times higher
likelihood of epithermal Au deposit occurrence in the predicted prospective areas than in