
Page 191 - Geochemical Anomaly and Mineral Prospectivity Mapping in GIS
P. 191
Knowledge-Driven Modeling of Mineral Prospectivity 193
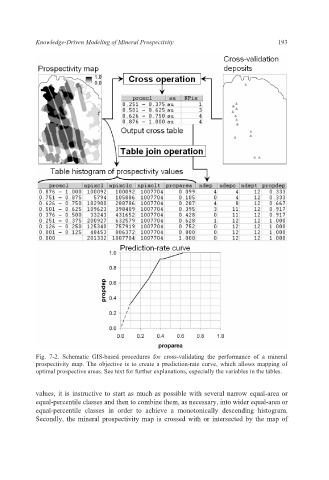
Fig. 7-2. Schematic GIS-based procedures for cross-validating the performance of a mineral
prospectivity map. The objective is to create a prediction-rate curve, which allows mapping of
optimal prospective areas. See text for further explanations, especially the variables in the tables.
values, it is instructive to start as much as possible with several narrow equal-area or
equal-percentile classes and then to combine them, as necessary, into wider equal-area or
equal-percentile classes in order to achieve a monotonically descending histogram.
Secondly, the mineral prospectivity map is crossed with or intersected by the map of