
Page 236 - Geochemistry of Oil Field Waters
P. 236
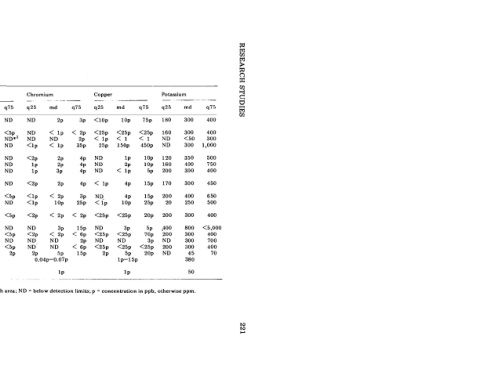
q75   400   400   300   1,000   500   750   400   450   650   500   400   <5,000   400   700   400   70


                                         md   300   300   <50   300   350   400   300   300   400   250   300   800   300   300   300   45   380   50
                                    Potassium   -   q25   180   160   ND   ND   120   160   200   170   200   20   200   .400   200   ND   200   ND   otherwise ppm.


                                         q75   75p   <25p   <1   450p   10P   10P   5P   15~   15~   25p   2Op   5P   70p   30   <25p   2Op


                                             lop   <25p   150p   1P   2P   < 1P   4~   4~   lop   <25p   3P   <25p   <25p   5p   lp-15p   1P
                                         md         <1                                   ND

                                    Copper   <lop   <25p   < 1P   25P   ND   ND   ND   < 1P   N   25~  4   1P   <   <25p   ND   <25p   ND   <25p   2p


                                         q75   3P   < 2P   2P   35P   4P   4P   4P   4P   3P   < 2P   15~   < 6~   20   < 6;   15p


                                                                                              5p     IP   ~~
                                      ~
                                                                                            ND   0.04~-0.07~  concentrations in each area; ND = below detection  1imits;p = concentration  in ppb,
                                    Chromium   ~


                                         q75   ND   ND*~   ND   ND   ND   ND   ND   <5P   ND   <5P   ND   <5P   ND   <5P   2P

                                           ~        ND*~  <5P

                                         md   ND   ND   ND   ND   ND   ND   ND   ND   ND   <5P   ND   <5P   ND   <5P   ND   0.27~   1P
                                           ~
                                    Cobalt   ND   ND   ND*~   ND   ND   ND   ND   ND   ND   ND   ND   ND   <5P   ND   ND   ND


                                      -      119   131   116   1   24   173   215   168   72   128   203   88   296   11   11   15   30   quartile (4)
                                    Dissolved solids (gll)   md   -  q75   98   70   69   30   66   27   222   173   111   61   143   70   115   80   55   42   67   53   137   51   59   9   173   115   5   3   5   4   5   3   18   5   35   -


                                    Number   of   samples   22   79   88   24   148   74   34   15   21   118   25   55   22   28   18   116   -   -   Rittenhouse et al., 1969)and  data, less sensitive methods of analysis used.

                              (continued)*'                                                            .-.      *3 Includes Oklahoma Platform and Ardmore Basin.


                              TABLE 7.XIV     Illinois Basin  Louisiana and Texas Gulf   Coast   East Texas   North Texas   West Texas and New   Mexico   Permian only   Pennsylvanian  only   Silurian and Devonian   only   Ordovician and   Cambrian only   Anadarko Basin*3   Williston Basin, post-   Paleozoic   Williston Basin,   Paleozoic   Powder River Basin   Other Wyoming   Colorado   California   Sea water   Estimated detection   limit   -   __   *' Medium (md -   No   *'