
Page 159 - Geology of Carbonate Reservoirs
P. 159
140 DEPOSITIONAL CARBONATE RESERVOIRS
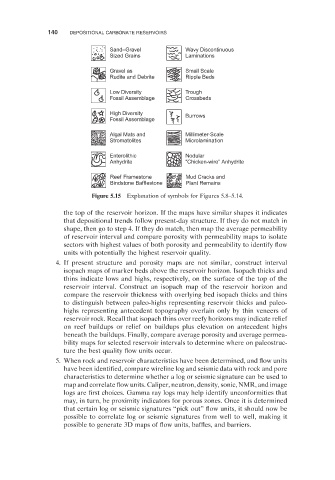
Sand–Gravel Wavy Discontinuous
Sized Grains Laminations
Gravel as Small Scale
Rudite and Debrite Ripple Beds
Low Diversity Trough
Fossil Assemblage Crossbeds
High Diversity Burrows
Fossil Assemblage
Algal Mats and Millimeter-Scale
Stromatolites Microlamination
Enterolithic Nodular
Anhydrite “Chicken-wire” Anhydrite
Reef Framestone Mud Cracks and
Bindstone Bafflestone Plant Remains
Figure 5.15 Explanation of symbols for Figures 5.8 – 5.14 .
the top of the reservoir horizon. If the maps have similar shapes it indicates
that depositional trends follow present - day structure. If they do not match in
shape, then go to step 4. If they do match, then map the average permeability
of reservoir interval and compare porosity with permeability maps to isolate
sectors with highest values of both porosity and permeability to identify fl ow
units with potentially the highest reservoir quality.
4. If present structure and porosity maps are not similar, construct interval
isopach maps of marker beds above the reservoir horizon. Isopach thicks and
thins indicate lows and highs, respectively, on the surface of the top of the
reservoir interval. Construct an isopach map of the reservoir horizon and
compare the reservoir thickness with overlying bed isopach thicks and thins
to distinguish between paleo - highs representing reservoir thicks and paleo -
highs representing antecedent topography overlain only by thin veneers of
reservoir rock. Recall that isopach thins over reefy horizons may indicate relief
on reef buildups or relief on buildups plus elevation on antecedent highs
beneath the buildups. Finally, compare average porosity and average permea-
bility maps for selected reservoir intervals to determine where on paleostruc-
ture the best quality flow units occur.
5. When rock and reservoir characteristics have been determined, and fl ow units
have been identified, compare wireline log and seismic data with rock and pore
characteristics to determine whether a log or seismic signature can be used to
map and correlate flow units. Caliper, neutron, density, sonic, NMR, and image
logs are first choices. Gamma ray logs may help identify unconformities that
may, in turn, be proximity indicators for porous zones. Once it is determined
that certain log or seismic signatures “ pick out ” flow units, it should now be
possible to correlate log or seismic signatures from well to well, making it
possible to generate 3D maps of flow units, baffles, and barriers.